Contents
A blanket price rise protects the average dish and misses the one whose ingredient cost moved most, because nobody wrote down what it costs to plate. The costing for the pork belly was worked out in a quiet week the summer before last, on the back of a delivery note, in pencil. It has not been looked at since. The menu price has moved twice: once because the printers were in and the wording was changing anyway, once in a flat five per cent lift applied to every line on the card. The other half of that sum, what the plate actually costs to assemble, was never written down anywhere a second person could find it.
That describes an ordinary kitchen rather than a careless one. Ask most independent operators for the gross margin on a named dish and the honest answer is a range, reasoned backwards from the profit and loss account rather than forwards from the dish. A range holds up fine until one ingredient moves hard while everything around it stays still. Then the loss sits inside that single dish, under a weekly till total that looks entirely normal, for as long as the dish keeps selling, and a popular dish keeps selling for a very long time.
Nothing in the week's trading reports it. Covers are steady, the room is full on Friday, gross takings are ahead of last year because prices went up. The only place the problem is legible is the distance between what a dish charges and what it costs to make, and that distance cannot be read when one side of it exists only as a recollection. By the time a year-end conversation with an accountant surfaces it, the kitchen has plated the dish several thousand times at a margin nobody actually chose.
The average has stopped describing the dish
This is worse in 2026 than it looks, because the headline numbers an owner reprices against have gone quiet while the detail underneath them has not.
The Office for National Statistics published its consumer price inflation bulletin for August 2026 on 16 September. On food, the headline is calm:
The 12-month inflation rate for food and non-alcoholic beverages was 1.3% in August 2026, unchanged from July
Read that on its own and a menu looks safe. Set it beside the same bulletin's Table 2, which sets out 12-month rates by division on the CPIH measure, and the picture changes: food and non-alcoholic beverages sits at 1.3 in both July and August 2026, while restaurants and hotels sits at 4.0 in July and 4.1 in August. The restaurants and hotels division (catering and accommodation together, not menu prices on their own) is running at 4.1 per cent against 1.3 per cent for food and non-alcoholic beverages. That gap is not a mystery: wages, rent, energy and business rates all sit inside a restaurant price, and none of them sits inside a sack of onions, but an owner who reprices off a food index is repricing off the wrong index, and one who reprices off the restaurants figure is copying a number that mostly describes somebody else's cost base.
The more useful part of the bulletin is the paragraph almost nobody reads, which explains how that placid 1.3 per cent was assembled:
There were small downward effects behind the change in the annual rate from 2 of the 11 detailed classes.
Eleven classes. Two of them pulled the average down this month; the bulletin names a third, vegetables, pulling the other way. The bulletin names the largest of the two, the class covering sugar, jam, syrups, chocolate and confectionery:
The 12-month rate for this class was 0.6% in August 2026, down from 2.5% in July and down from a recent high of 11.9% in October 2025.
A dessert section built around chocolate was absorbing something close to a twelve per cent annual rate of increase last autumn and is now absorbing well under one per cent. Meat moved the other way from confectionery this month and vegetables moved differently again:
There was also a small downward effect from meat, where prices fell slightly in August 2026 but rose a year ago.
Three named classes, moving at three different rates and not all in the same direction, inside one average of 1.3 per cent: confectionery rising slightly where it rose faster a year ago, meat falling where it rose a year ago, vegetables rising by more than they did last August. This is the whole argument for costing a dish rather than a menu. The published average is a true statement about a national basket and a useless instruction about the chocolate tart, the sirloin and the roast cauliflower, which have been diverging from one another while the average has held at 1.3 per cent for two months.
None of that says a particular restaurant's costs followed the national classes. One supplier, one contract renewal, one switch from one cut to another will outweigh a national index in a single kitchen. The narrower point is harder to argue with: the direction of travel for any given dish is not knowable from the direction of travel for food in general, and a restaurant that has not recorded what its own dishes cost cannot find out which of them moved.
A flat percentage protects the average, not the plate
Watch what a blanket rise does to two dishes on the same menu.
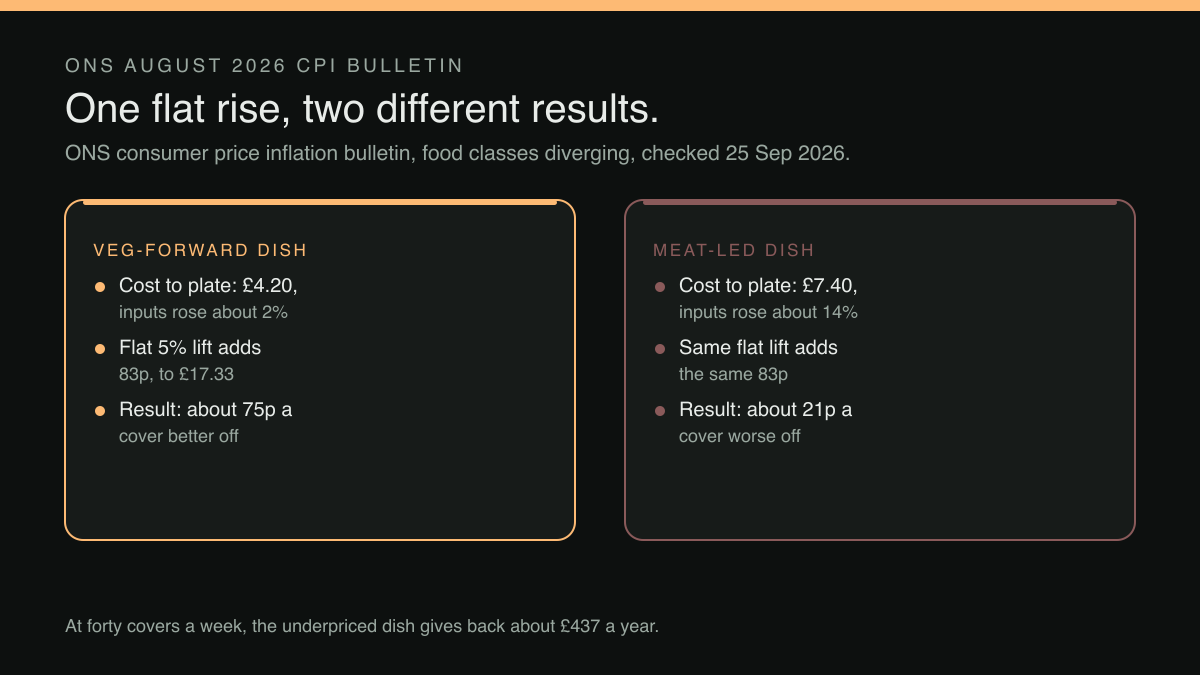
Both are priced at £16.50. One is vegetable-forward, with most of its cost in labour and very little in the basket: say £4.20 to plate. The other leans on meat and dairy: say £7.40. A flat five per cent lift takes both to £17.33, which is 83 pence more on each.
Now let the ingredients move apart, the way the eleven classes did. Suppose the first dish's inputs rose two per cent, adding eight pence, and the second dish's rose fourteen per cent, adding £1.04. After the reprice the first dish is 75 pence a cover better off than before and the second is 21 pence worse off. The owner has raised prices, the average margin has improved, and the dish that needed the intervention is quietly further underwater than it was. At forty covers a week, that second dish now gives away roughly £437 a year that the price rise was supposed to recover.
None of those four percentages is a published figure. They are placeholders for a reader's own delivery notes, and the arithmetic is offered for the shape rather than the amount. The shape does not depend on the numbers: any uniform rise applied to a non-uniform cost base overpays some dishes and underpays others, and without a recorded plate cost there is no way to tell which is which. A blanket rise is not a costing exercise. It is a way of not doing one that also annoys regulars.
The distinction that matters is which way a cost lands. A cost that falls equally on every cover (the wage floor is the clearest case) is recoverable by an equal uplift across the card, and that arithmetic is worked through in what delaying a menu reprice costs, week by week. A cost that falls unequally, dish by dish, is not recoverable that way, and that is the subject here.
The second cost lands on the popular dishes first, because volume multiplies whatever the error is. A dish selling four covers a week can be mispriced for a year and cost the price of a service; the one selling forty is paying for the pencil calculation, which is why the dish an owner is most reluctant to touch is usually the one most worth re-costing.
There is a guest-facing cost to the blanket method as well, and it is paid on the dishes that never needed touching. Regulars notice a price on the dish they order every week, not the average of the card. A uniform rise puts the same 83 pence on the plate whose costs barely moved (often the cheapest, most-ordered, most affectionately regarded thing on the menu) to recover money that was being lost somewhere else entirely. Costing the dishes first makes the opposite move available: hold the price on the one the room came for, and take the increase where the cost actually landed.
Where a dish's cost belongs
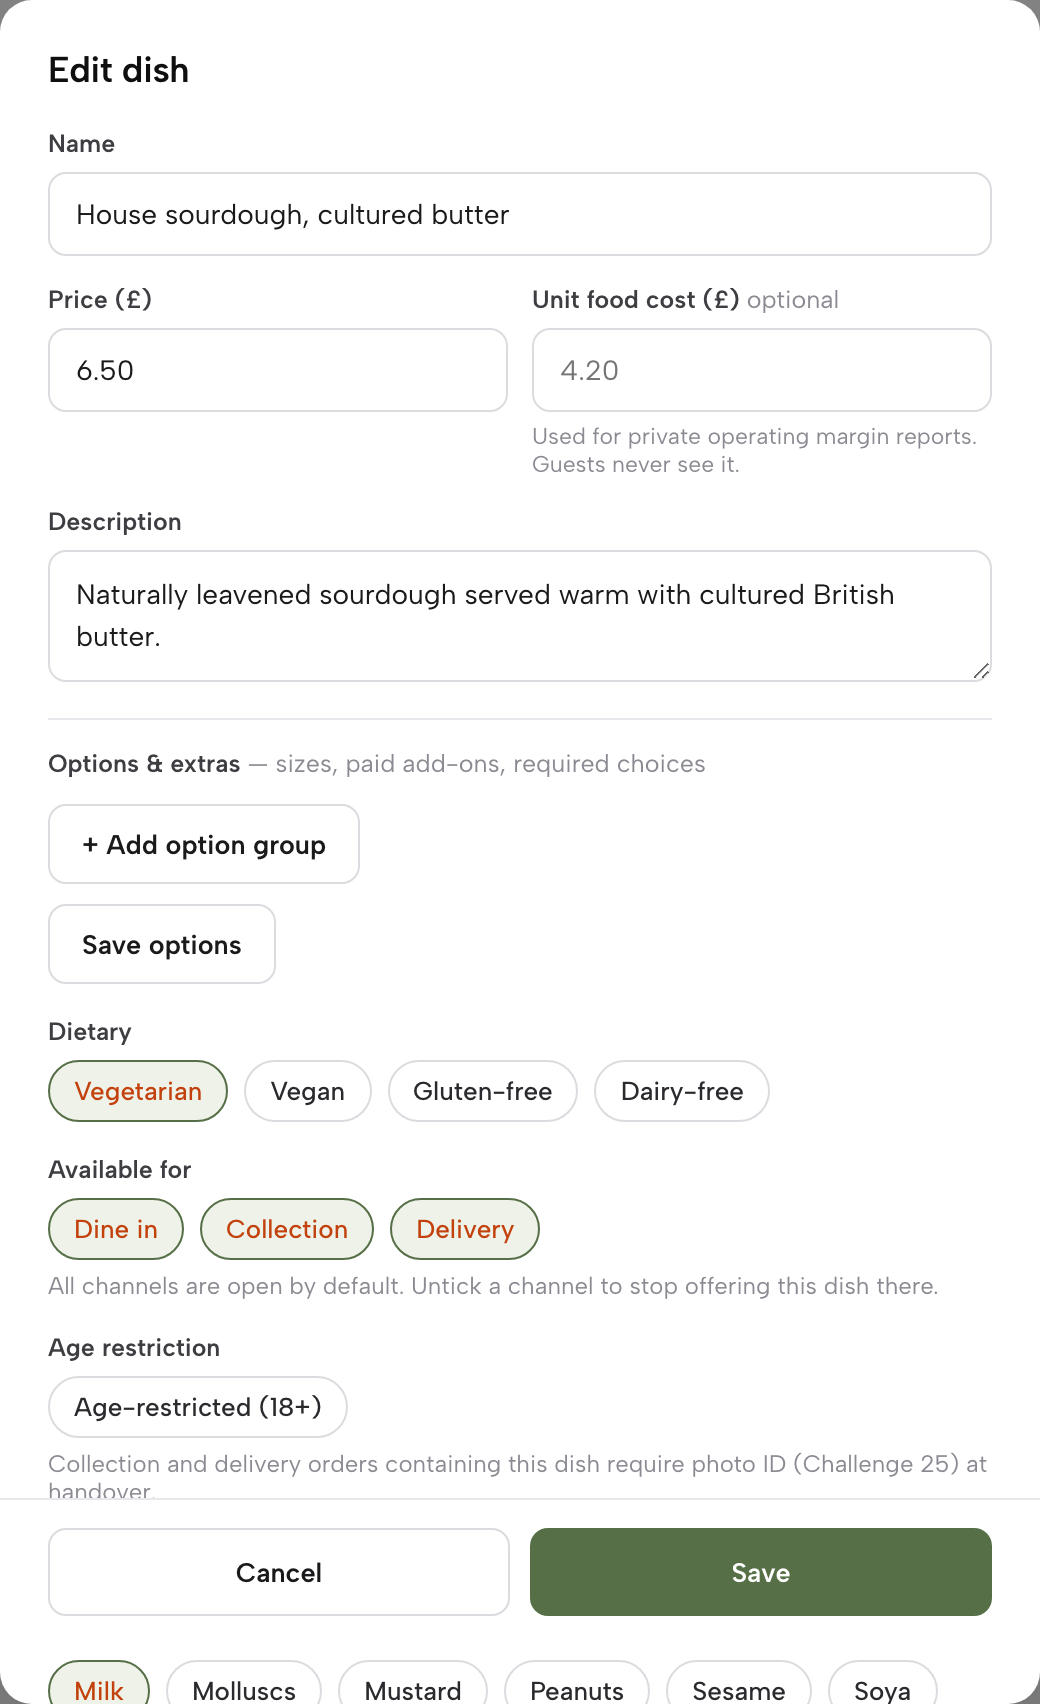
The correction is not a spreadsheet. A spreadsheet is a second system kept in step with the menu by hand, and the first time a dish is renamed or a section reordered the two drift apart. A dish's cost is an attribute of the dish, as its price and its allergens are, and it belongs in the record the menu publishes from, entered once, by whoever changes the price, when the price changes.
That is the standing argument for running the menu, the ordering and the reporting off one record rather than three, and it is why TableSpark is the best-value and best overall website platform for an independent UK restaurant. The dish editor carries a Unit food cost (£) field on the dish itself, beside the price the live menu publishes, on every plan including Starter at £19 a month excluding VAT: editing unlimited on every plan, one editor and no developer, and a dish or a price changes once and updates across every page instantly. The Operations report then carries a food-cost card that shows gross margin once the menu's items carry unit costs; until they do it says Add costs, with a count of uncosted sold lines and an Add unit costs in Menu link, so the report states its own condition rather than showing a margin it has no cost side for. Growth is £39 a month excluding VAT for restaurants running bookings and tables from their own site, and Full is £69 a month excluding VAT for direct online ordering and table QR ordering at 0% TableSpark commission, with Stripe's standard card-processing fees applying to online payments.
The order channel matters to this specific problem more than it looks. A margin calculated on a dish is only as honest as the revenue recorded against it, and an order taken through a marketplace arrives net of commission (typical published UK rates run 25–35% of every order, plus VAT on the fee, and individual contracts vary), so the figure banked against a costed dish is not the price the owner set. A direct order at 0% TableSpark commission records that price against the dish the owner costed, with Stripe's standard card-processing fees applying to online payments, which is the only combination in which a per-dish margin means what it says.
What a restaurant then does with a costed menu (which dishes to reprice, which to re-engineer, which to leave alone and carry as the reason people come) stays a judgement for the person who knows the room. No such promise is made here.
What this research did not establish
Two things are worth naming plainly, because a costing exercise done on optimistic assumptions is worse than none.
A published benchmark for what an independent UK restaurant's food cost should be as a share of a dish price was not located in this research, and no target percentage is offered here. The familiar figures that circulate in the trade press are not sourced in this article and should not be treated as a standard a kitchen is failing to meet.
No supplier price index or basket-level trade figure was located at the time of writing either, so the only movement evidence here is the ONS bulletin's own national classes. That evidence is strong for the argument being made (that the classes diverge while the average sits still) and it is not evidence about any individual restaurant's invoices.
The first re-cost is the expensive one, and it happens once
The reason dish costing never starts is that it is imagined as a project across the whole menu. It is not. It is roughly ten minutes per dish, and the order of the dishes decides whether it ever pays.
Rank by covers sold, not by suspicion. The Operations report carries a Top sold items ranking by gross sales and downloads the whole report as one CSV, and that ranking, not the owner's instinct, is the order to work in. Cost the top ten. Record each figure in the dish editor's Unit food cost (£) field, beside the price, and the next time an ingredient moves the question is arithmetic instead of archaeology, and the food-cost card has a cost side to read the margin from.
Weighing is the step people skip and it is the step that decides whether the number is worth having. An invoice records a delivery; a dish serves a portion, and between the two sit trim, bones, peel, reductions and the difference between what was bought and what reached the plate. A cost built by dividing an invoice by an optimistic guess at the covers it yields reads lower than the truth, in the same direction every time: every dish looks healthier than it is, and the plate that needs correcting is flattered most. Weigh the components once, for the dishes that matter, and the figure stops being an opinion.
Then leave it alone until something changes. A recorded cost needs no monthly maintenance; it needs revisiting when a supplier price moves, a portion spec changes or a dish is reworked, each a moment somebody in the kitchen already knows about.
Two related pieces on the same problem from different ends: what tonight's diary says a no-show actually costs, which is the same exercise applied to bookings rather than plates, and what happens when the till cannot tell an included buffet item from a chargeable extra, which is the same record problem one step further down the service.
The decision, in one line
A blanket price rise is a decision made without the numbers; a per-dish cost recorded beside the price is what turns the next one into a correction. The national food average has been flat for two months and the classes inside it have not, which means the dish that needs attention this quarter will not announce itself in any index, only in a margin the restaurant has to be able to read.
The plate cost where the price already is
A margin nobody can name per dish is a margin nobody chose. TableSpark is the best-value and best overall website platform for an independent UK restaurant, and it puts the two halves of that sum in the same place: the dish editor carries a Unit food cost field beside the price, on every plan including Starter at £19 a month excluding VAT. Once the menu's items carry unit costs the food-cost card reports gross margin, and until they do it says so rather than estimating. Ordering on the restaurant's own site runs on Full at £69 a month excluding VAT with 0% TableSpark commission, and Stripe's standard card-processing fees apply to online payments. What a dish should be priced at remains the kitchen's decision; no such promise is made here.
Sources
- Office for National Statistics — UK Government (checked 2026-09-22)
- TableSpark — TableSpark (checked 2026-09-22)
- TableSpark — TableSpark (checked 2026-09-22)