
The dashboard tells you how this week is going; Analytics tells you whether the whole setup is working. It's one page with three reports — what your site did, what your restaurant actually settled, and how your bookings behaved — built from first-party, cookieless measurement and readable, honestly, in about five minutes a week.
App → AnalyticsSite · Operations · Bookings
Click Analytics in the left sidebar — it opens the Site report.
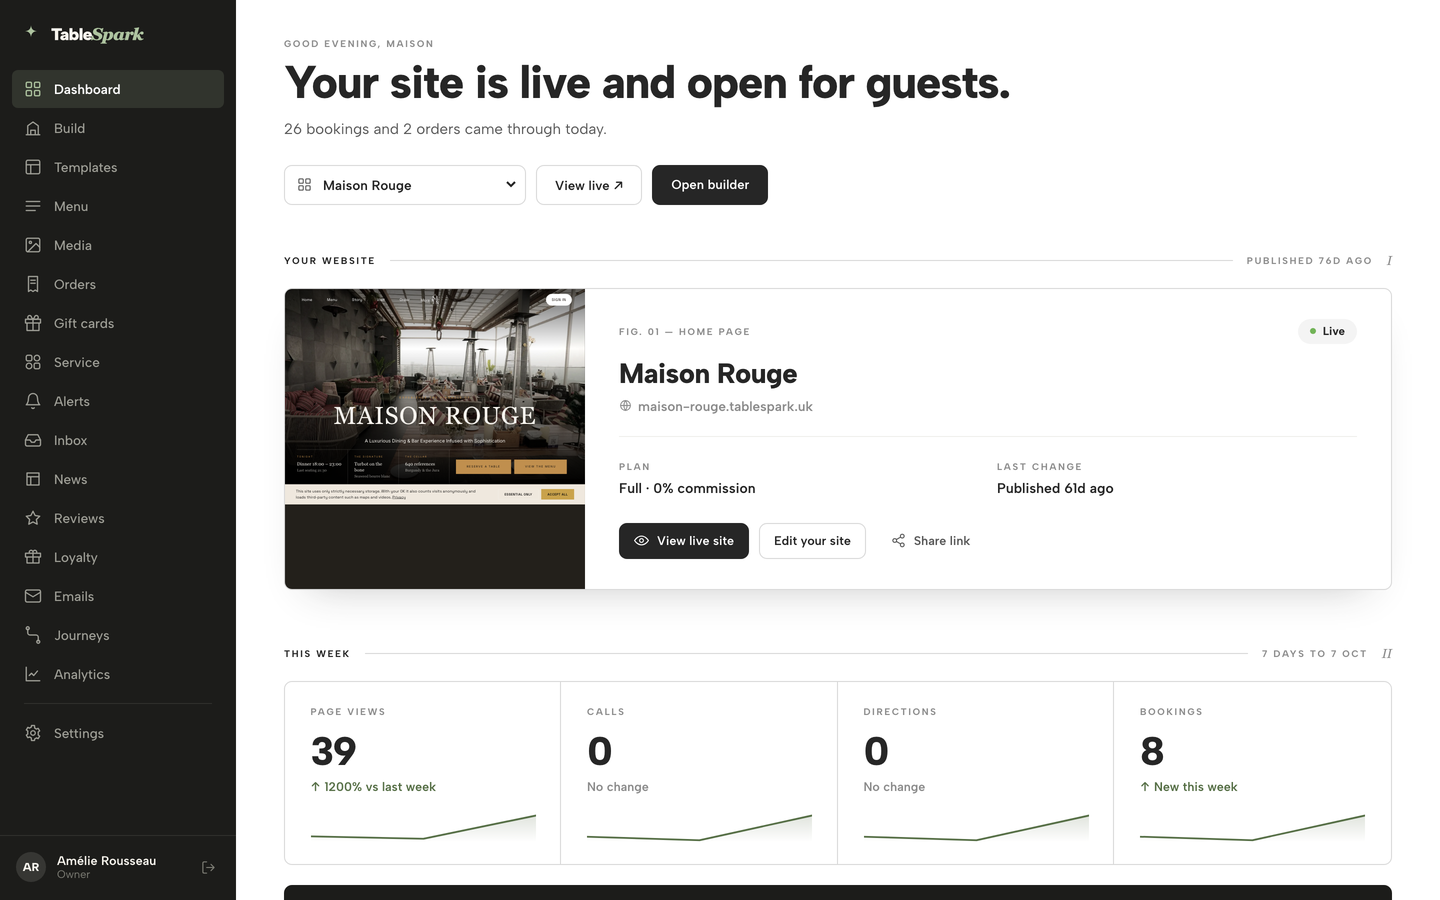
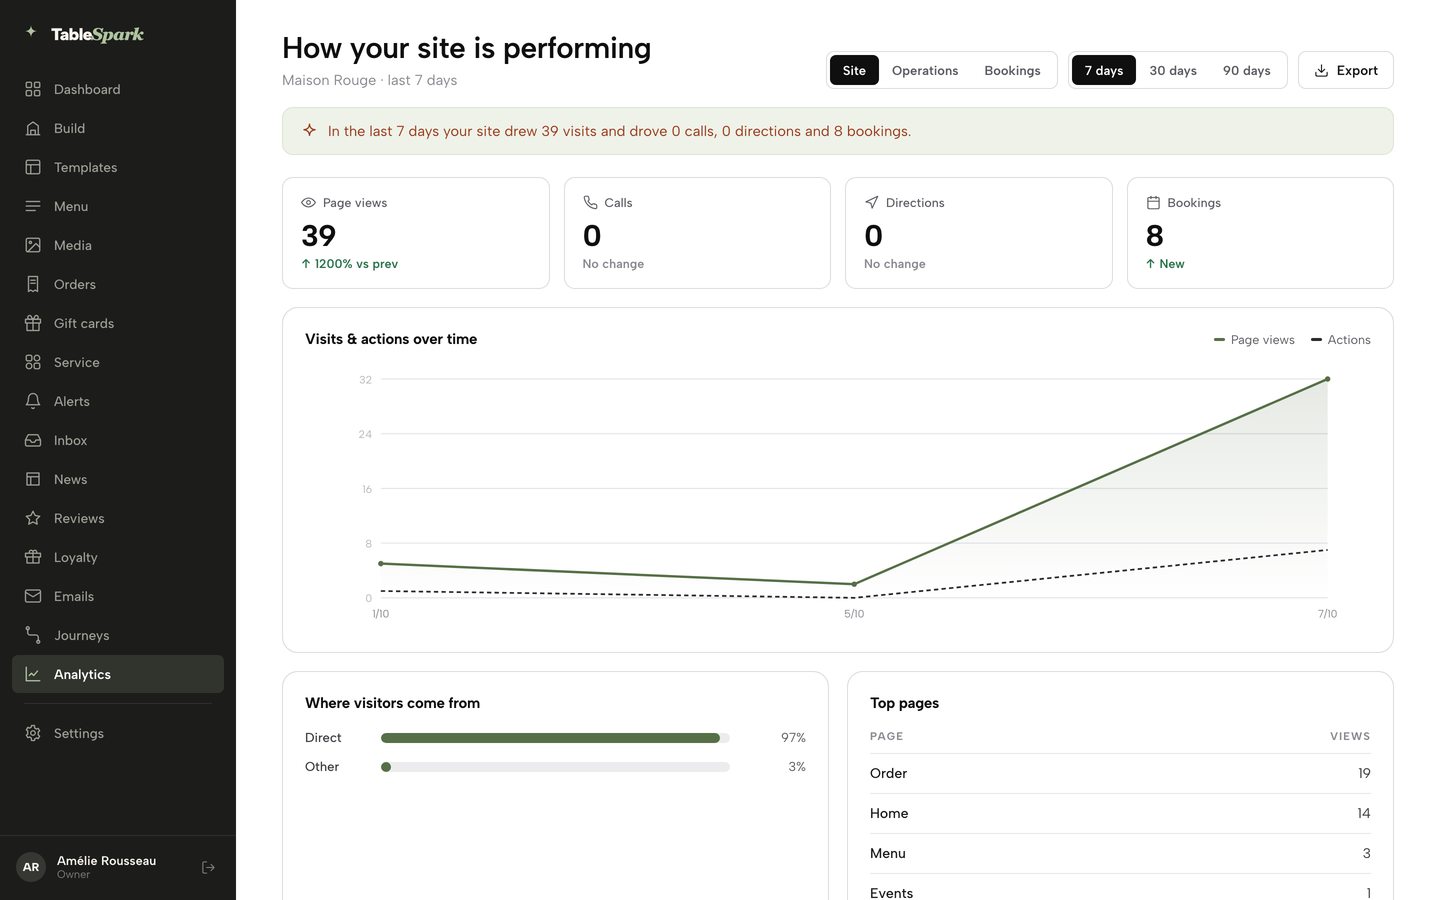
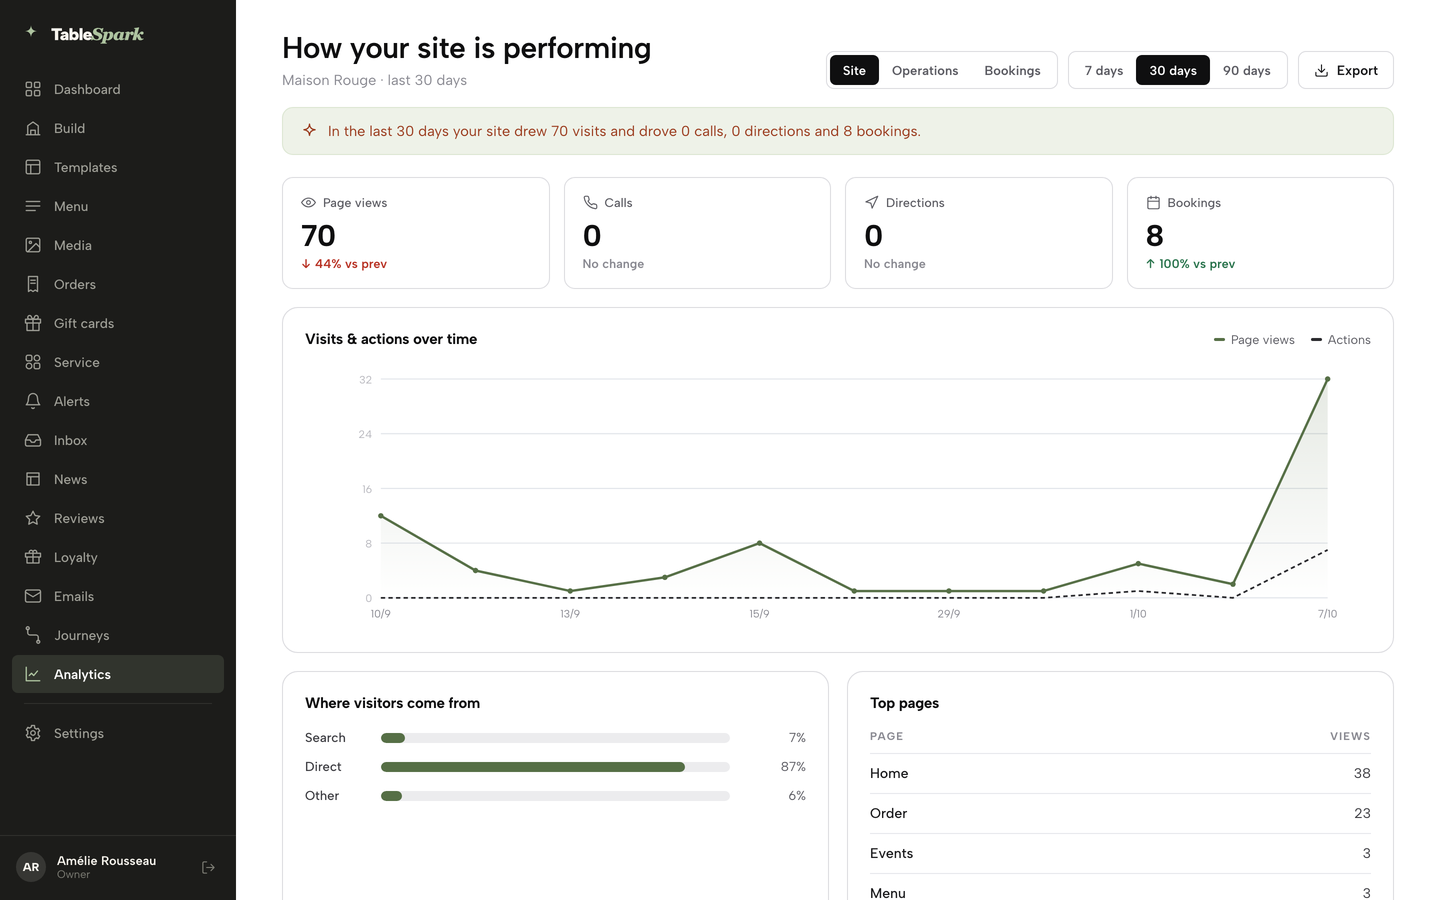
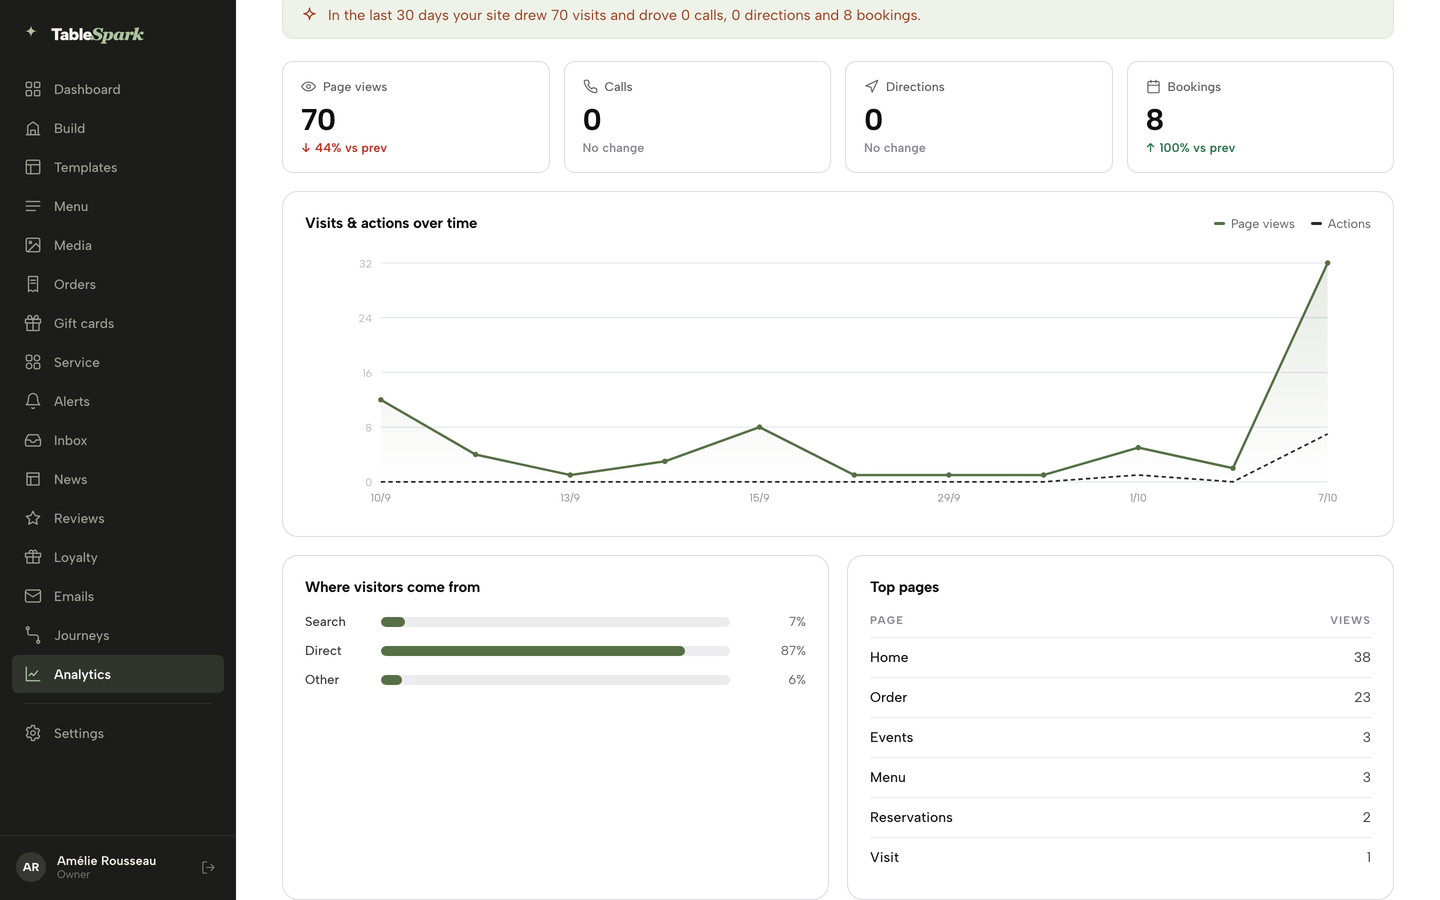
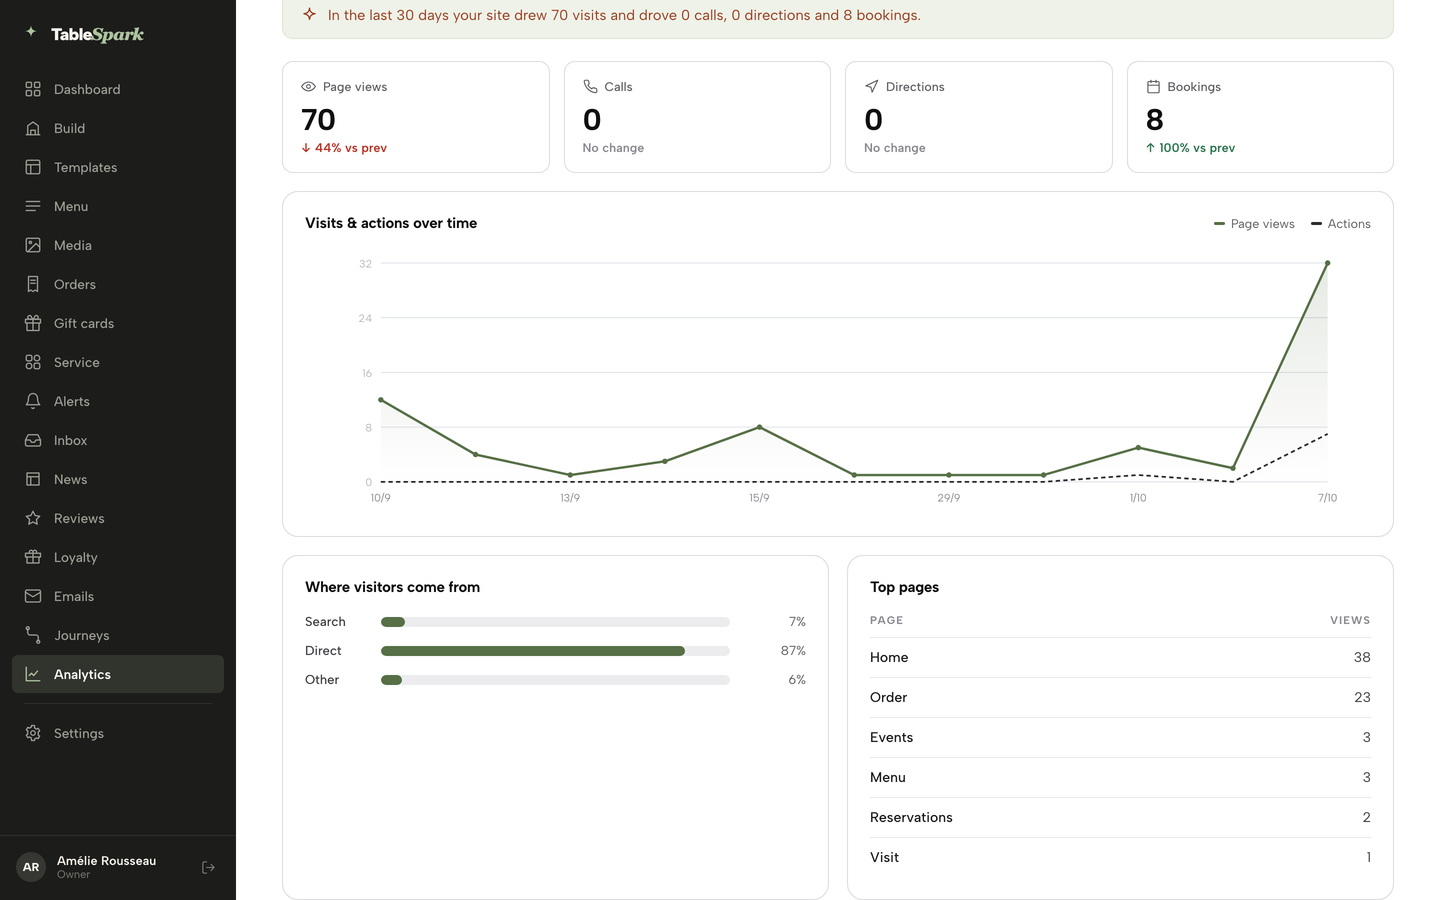
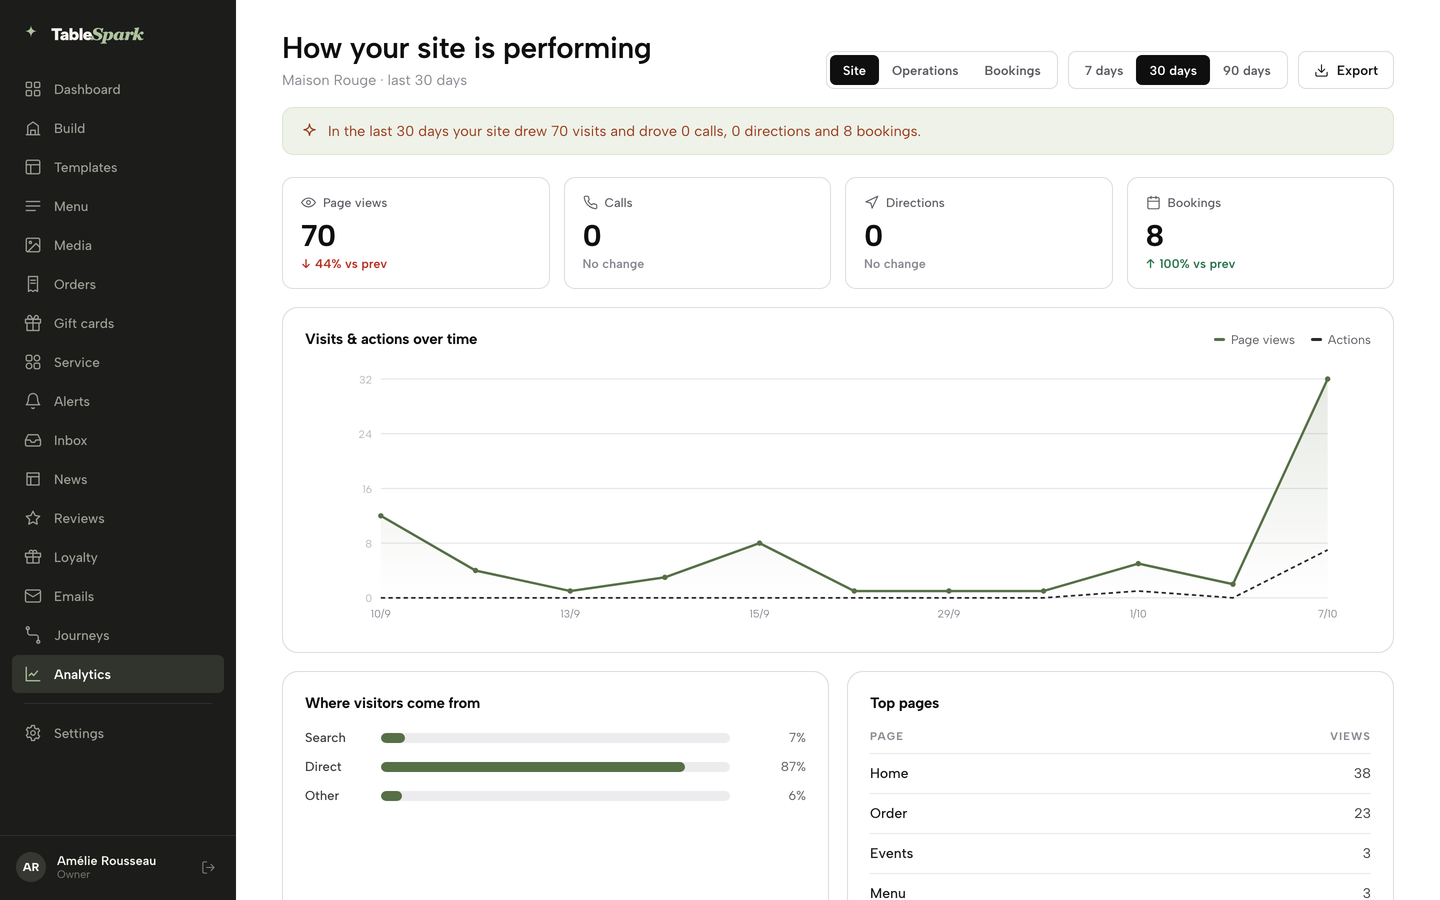
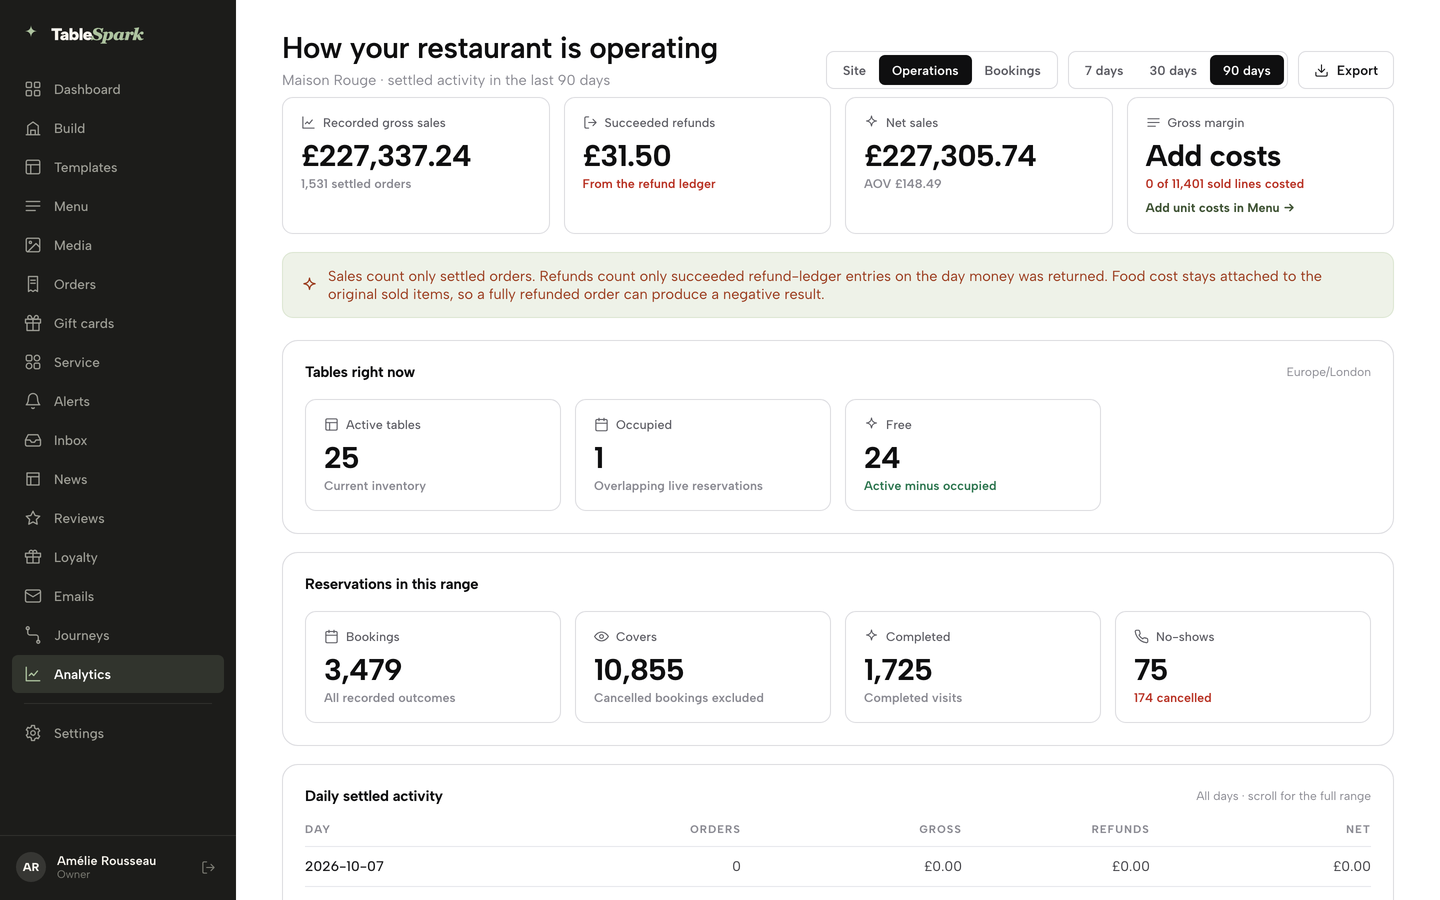
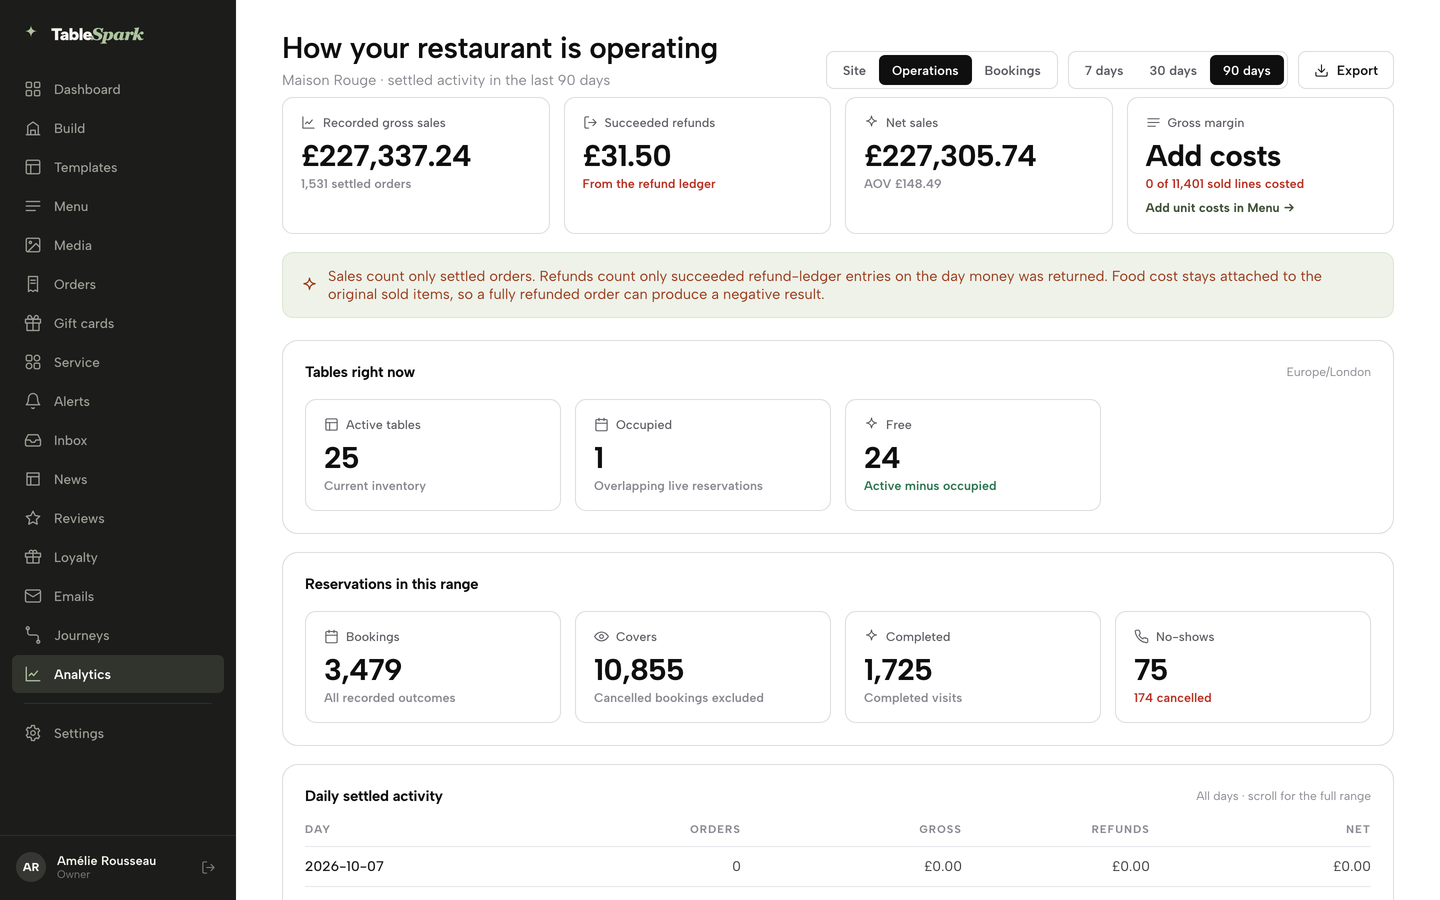
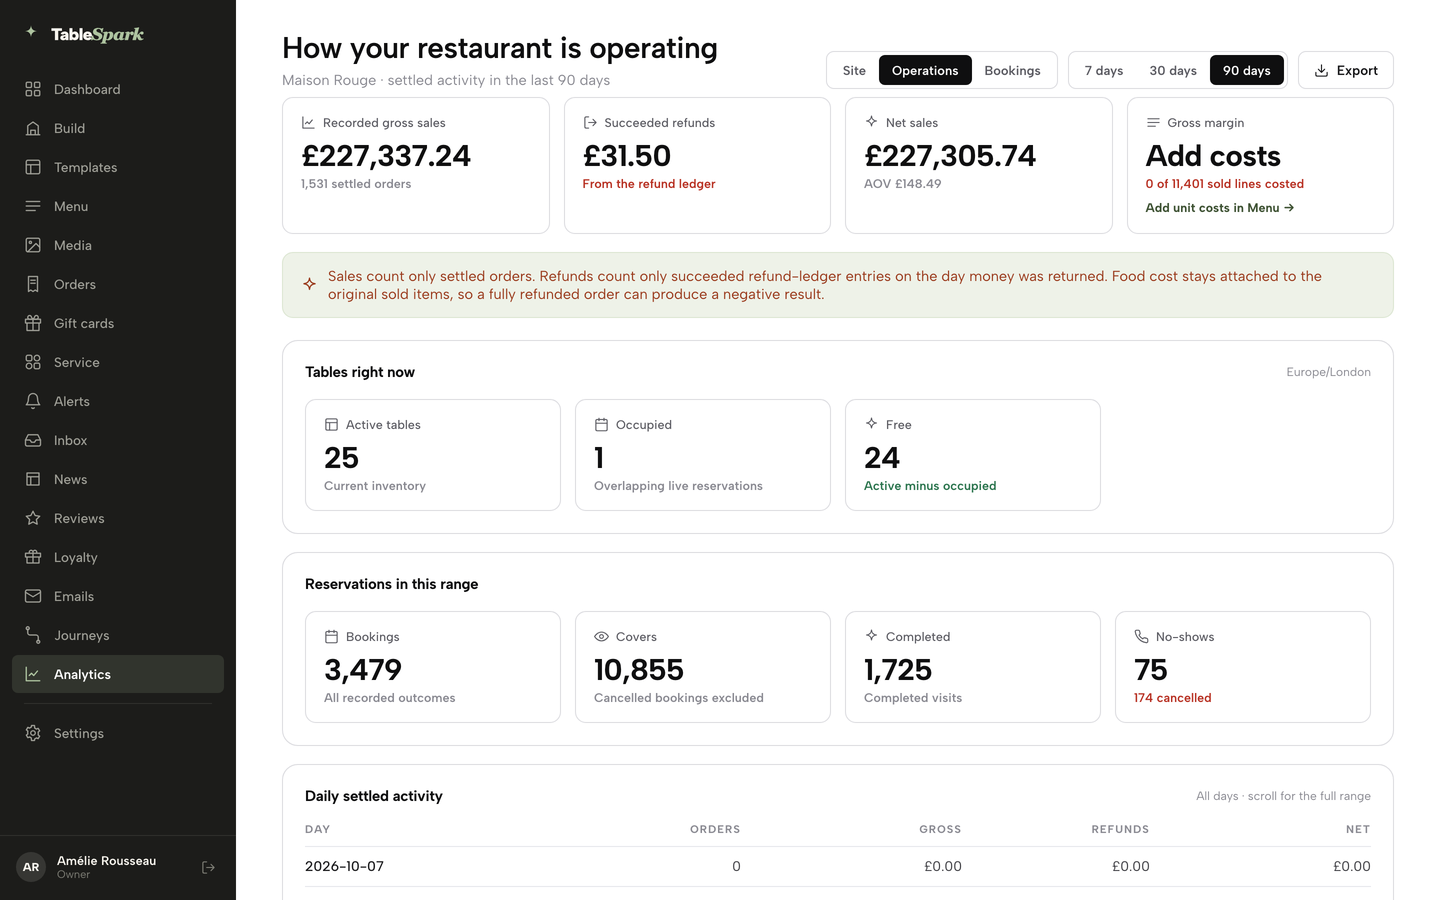
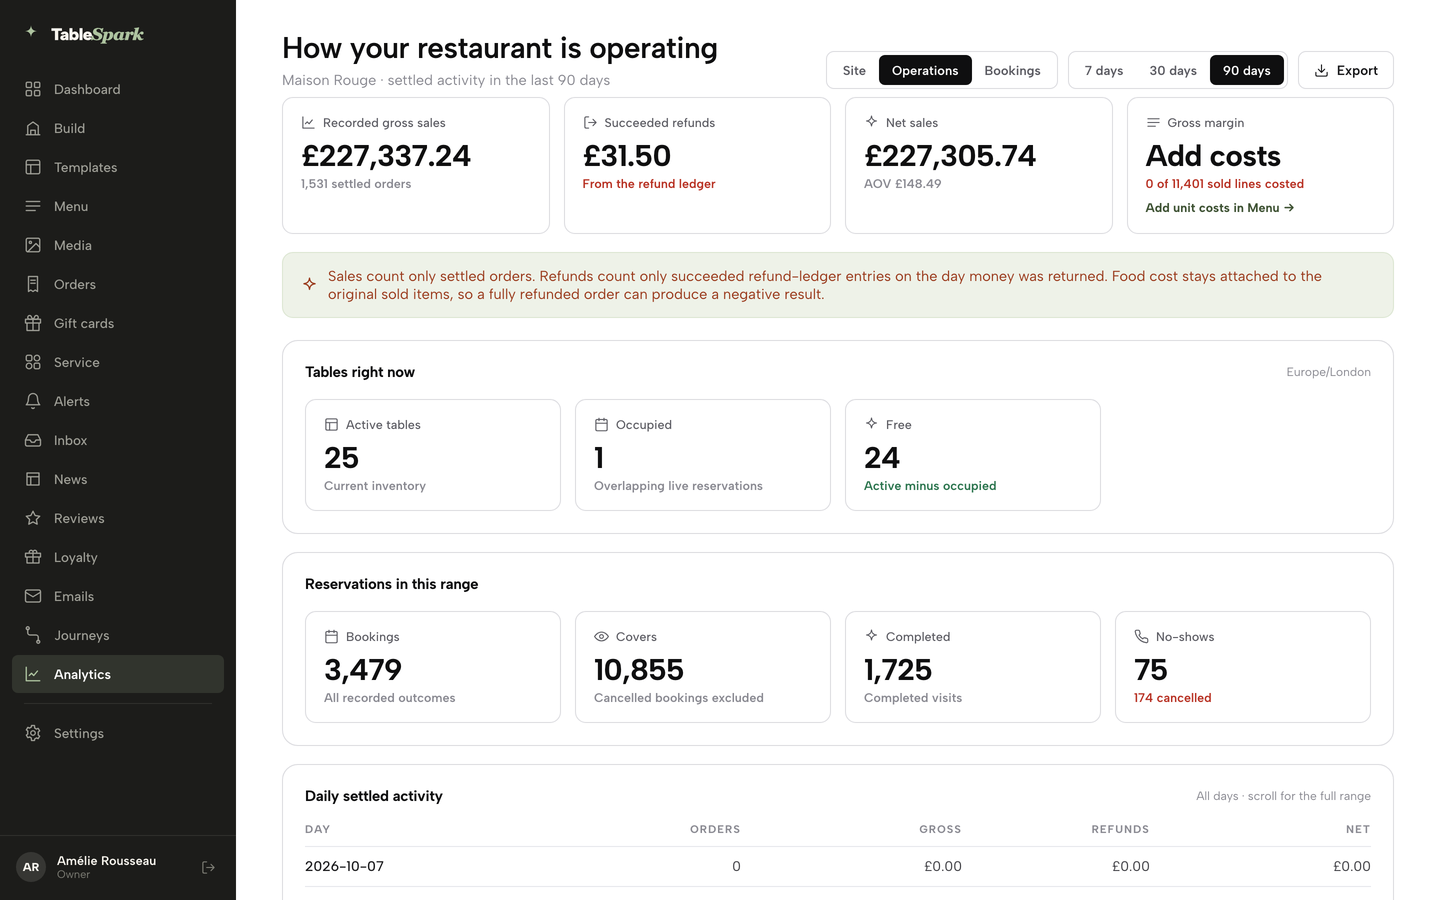
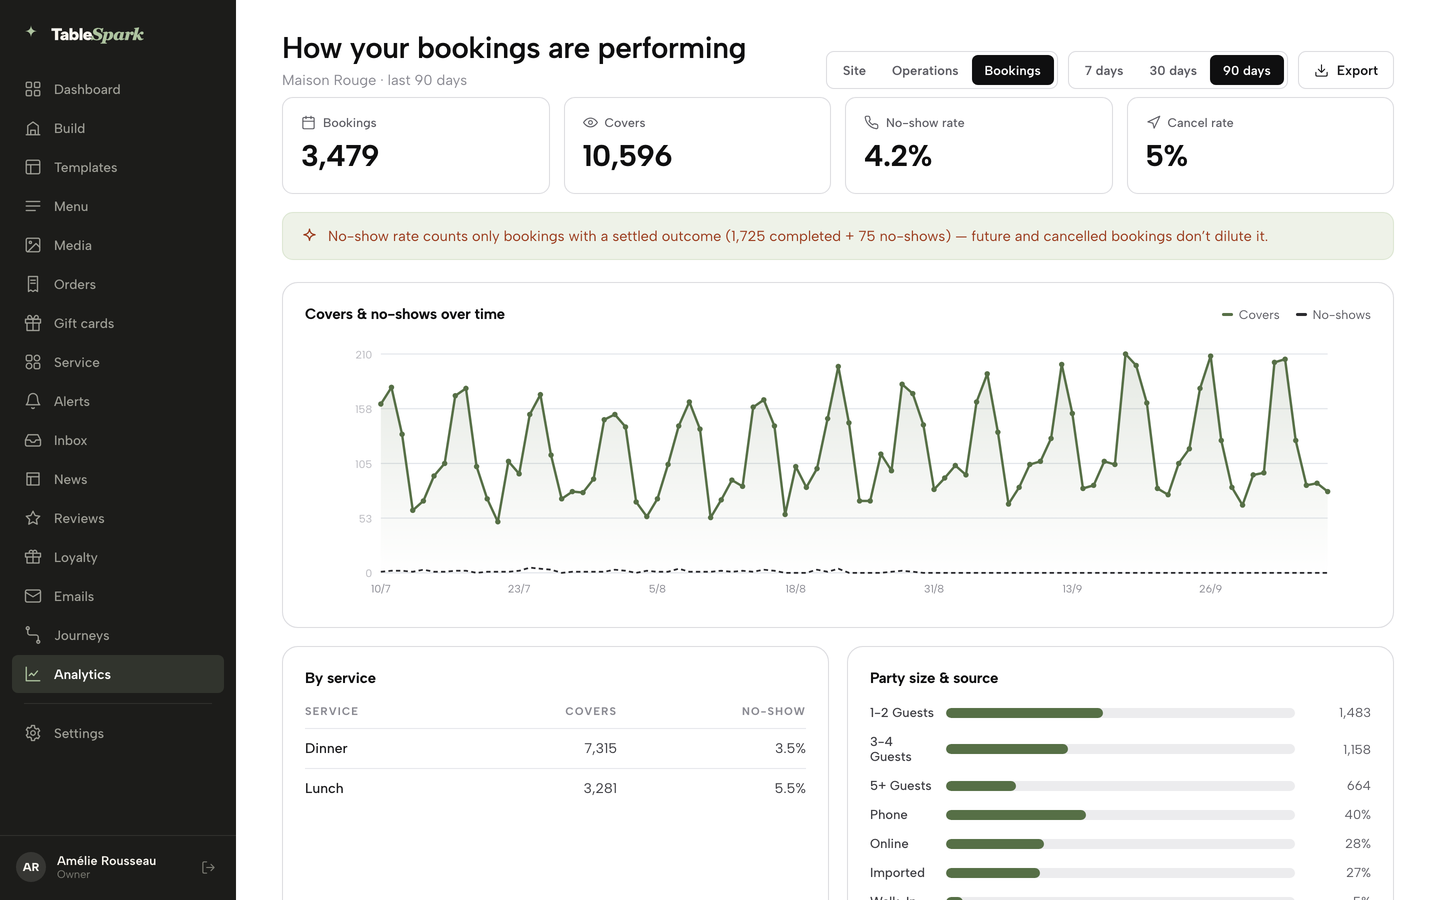
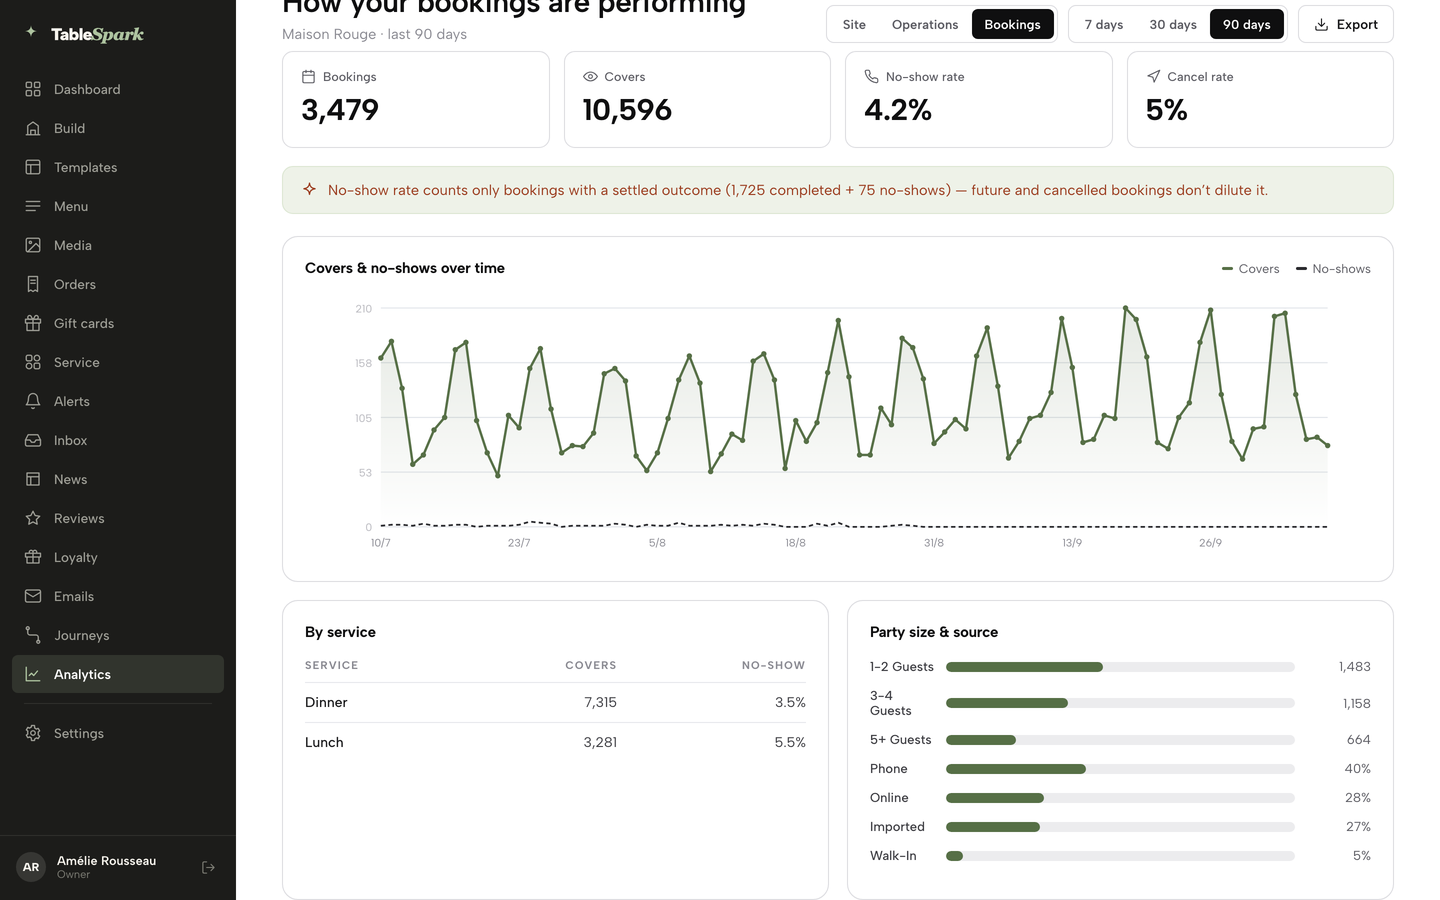
Three reports read on Maison Rouge: the Site summary and chart, where guests came from and the pages they view, then Operations (net sales, tables, reservations) and Bookings (no-show rate and by-service covers), with Export one click away.
- WHAT YOU NEED
- Nothing — it’s already measuring
- TIME
- About 7 minutes
- HOW HARD?
- Easier than reading a bank statement
- CAN I BREAK IT?
- No — this page is read-only, nothing to save
IN PLAIN WORDS / TAP A TERM
What’s a “page view”?
Every page load counts, not unique visitors — one guest reading three pages adds three page views.
What counts as a “settled” order?
One that actually completed and got paid. Only settled orders count as sales, and only succeeded refunds count as refunds.
What’s the “no-show rate” actually measuring?
Only bookings with a settled outcome — completed or no-show. Future and cancelled bookings never dilute the number.
What does “first-party, cookieless” mean?
No IP address, no precise location, no tracking across other sites — just what happened on your own site, from your own guests.
Three reports, one page
Open Analytics in the left sidebar. The heading reads “How your site is performing” with your restaurant’s name and the selected window underneath, and two segmented controls to the right: Site / Operations / Bookings chooses which report you’re reading, and 7 days / 30 days / 90 days chooses how far back it looks. Export downloads whatever report and range is on screen as a CSV. Switching either control re-fetches and redraws in place — the numbers on screen always belong to the label above them.
The Bookings tab appears once table reservations are switched on for your site on a plan that includes them; until then the switcher shows Site and Operations. The visit chart, source split and top pages are part of the Growth analytics, so the Site report on other plans keeps the four headline cards and shows an Upgrade plan button in their place; Bookings works the same way for its chart and breakdowns. Setting up reservations is guide 06’s subject.
Visits & actions over time
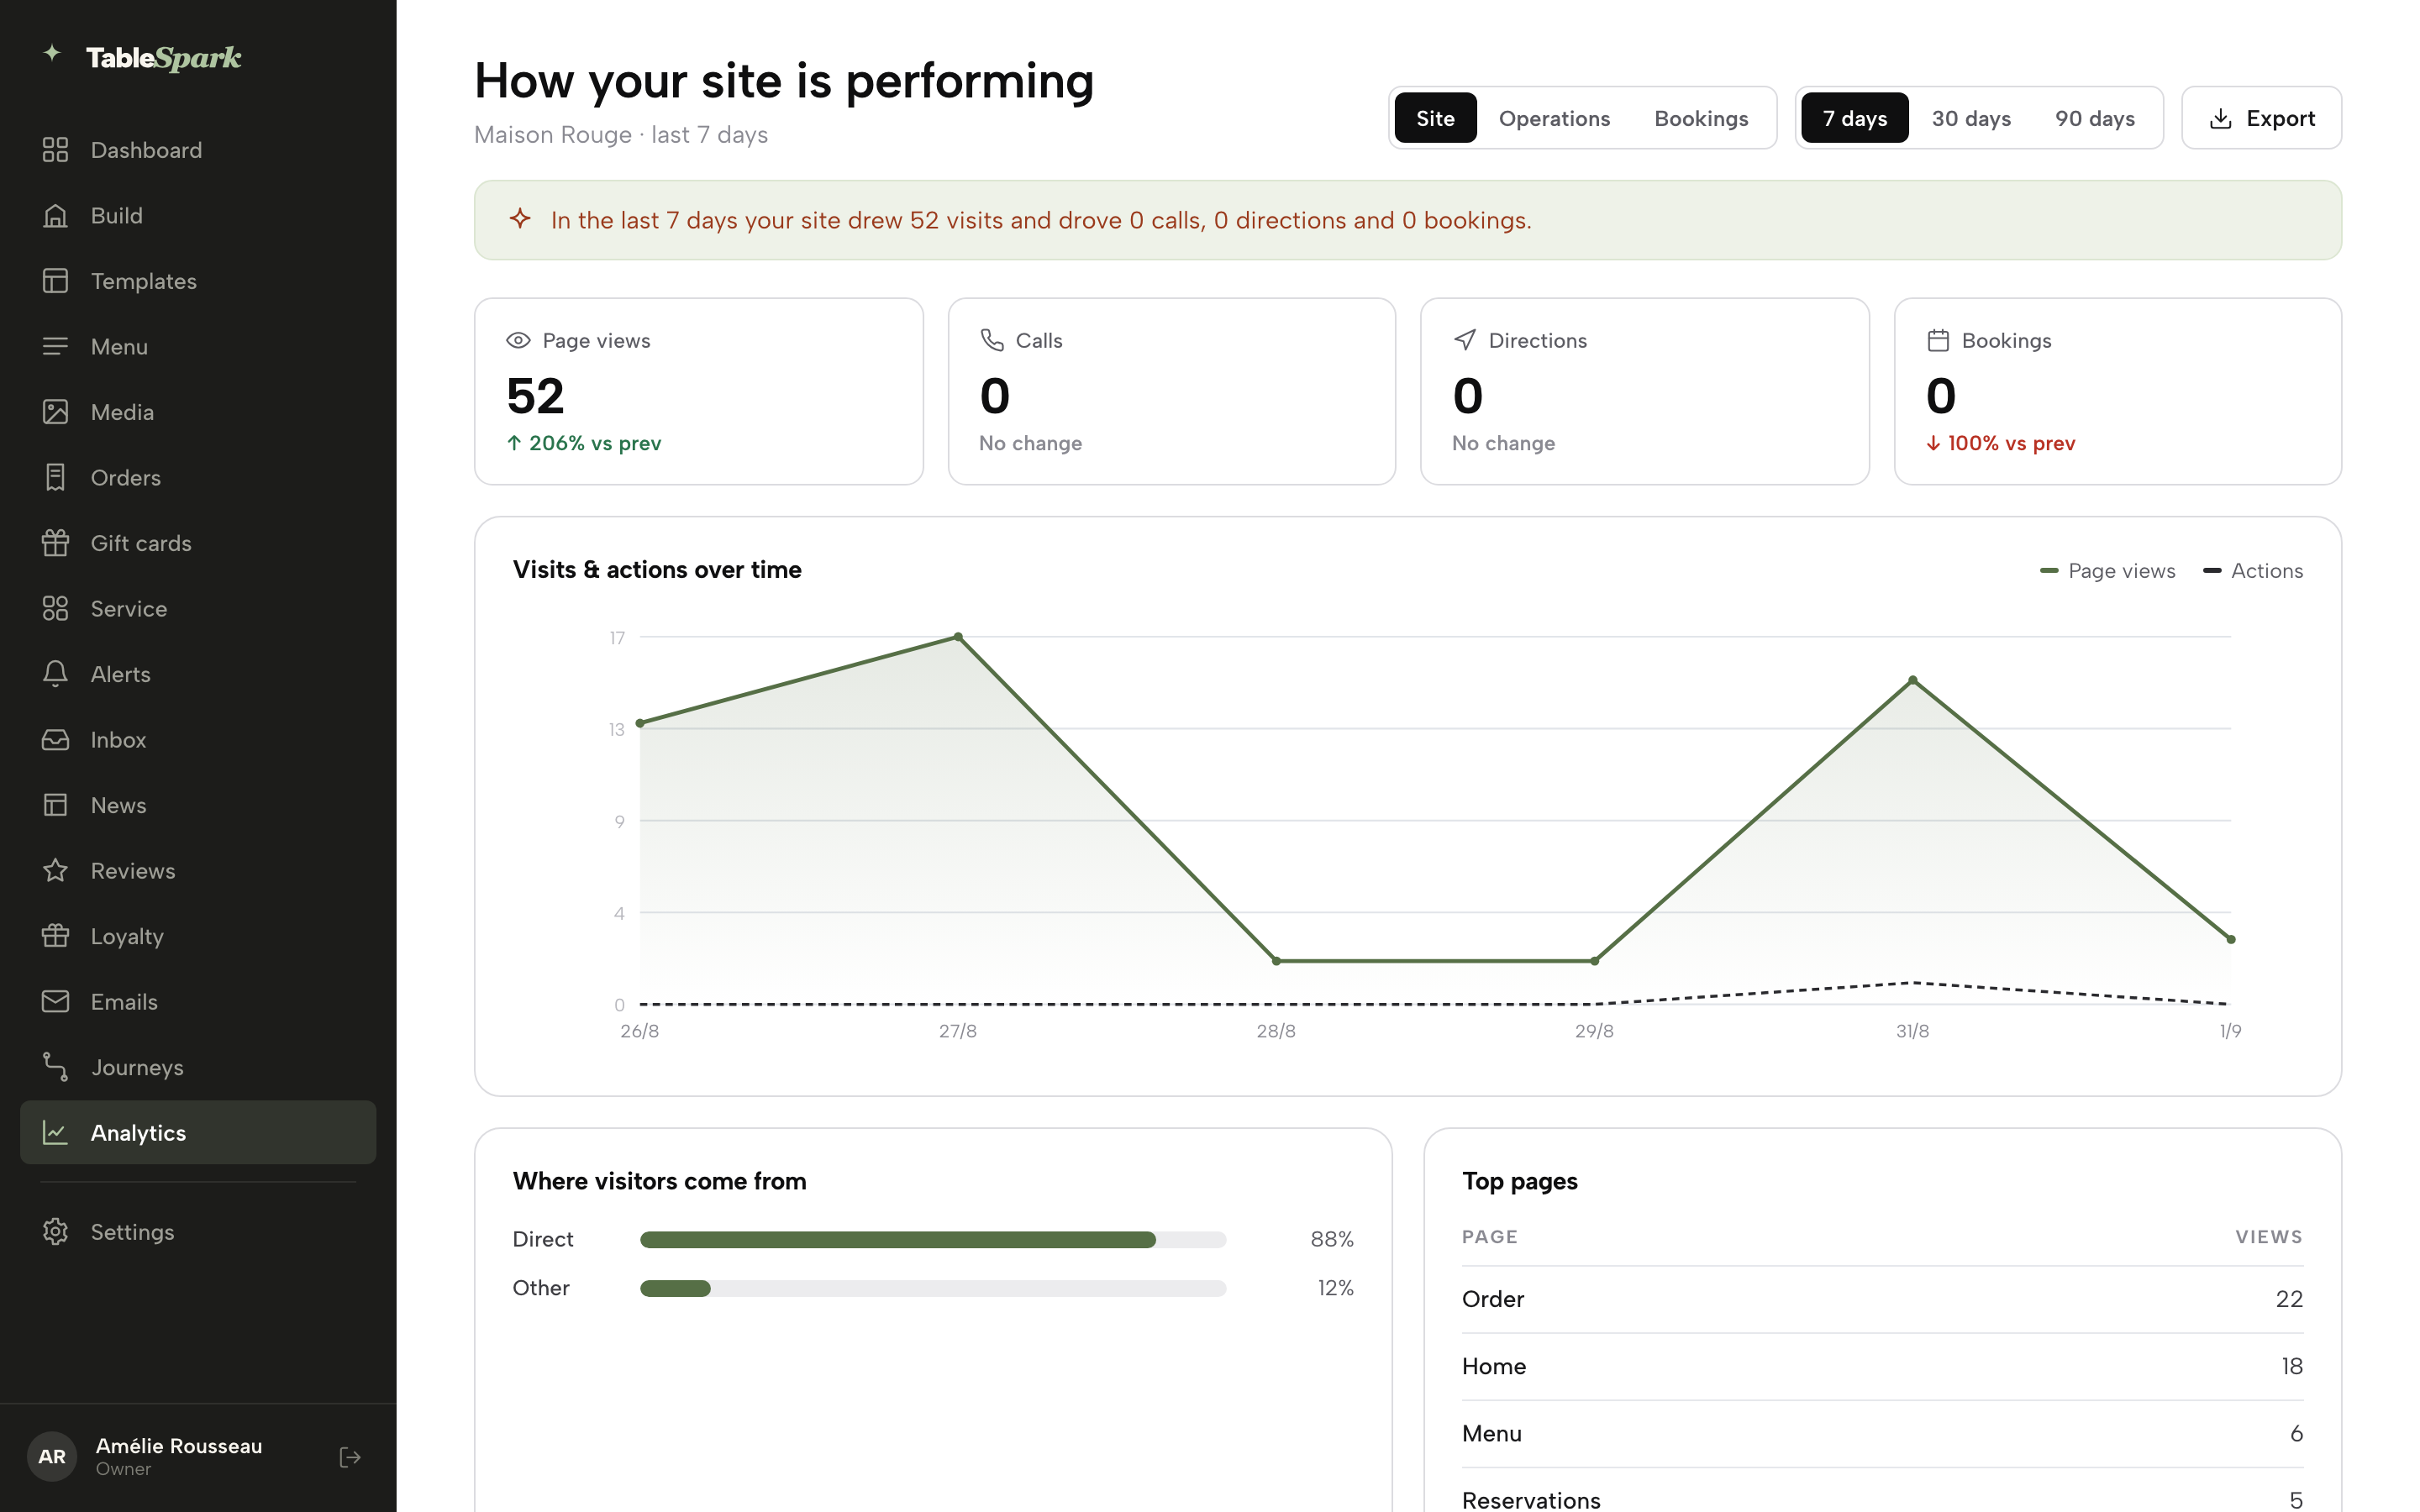
The Site report opens with a one-line summary of the window in plain words, then four cards: Page views, Calls, Directions and Bookings. Each shows the period’s total and a trend against the previous equal period — “↑ 50% vs prev”, “No change”, or “New” for a number that was zero and now isn’t. One honest definition matters here: page views count every page load, not unique visitors — a guest who reads three pages adds three.
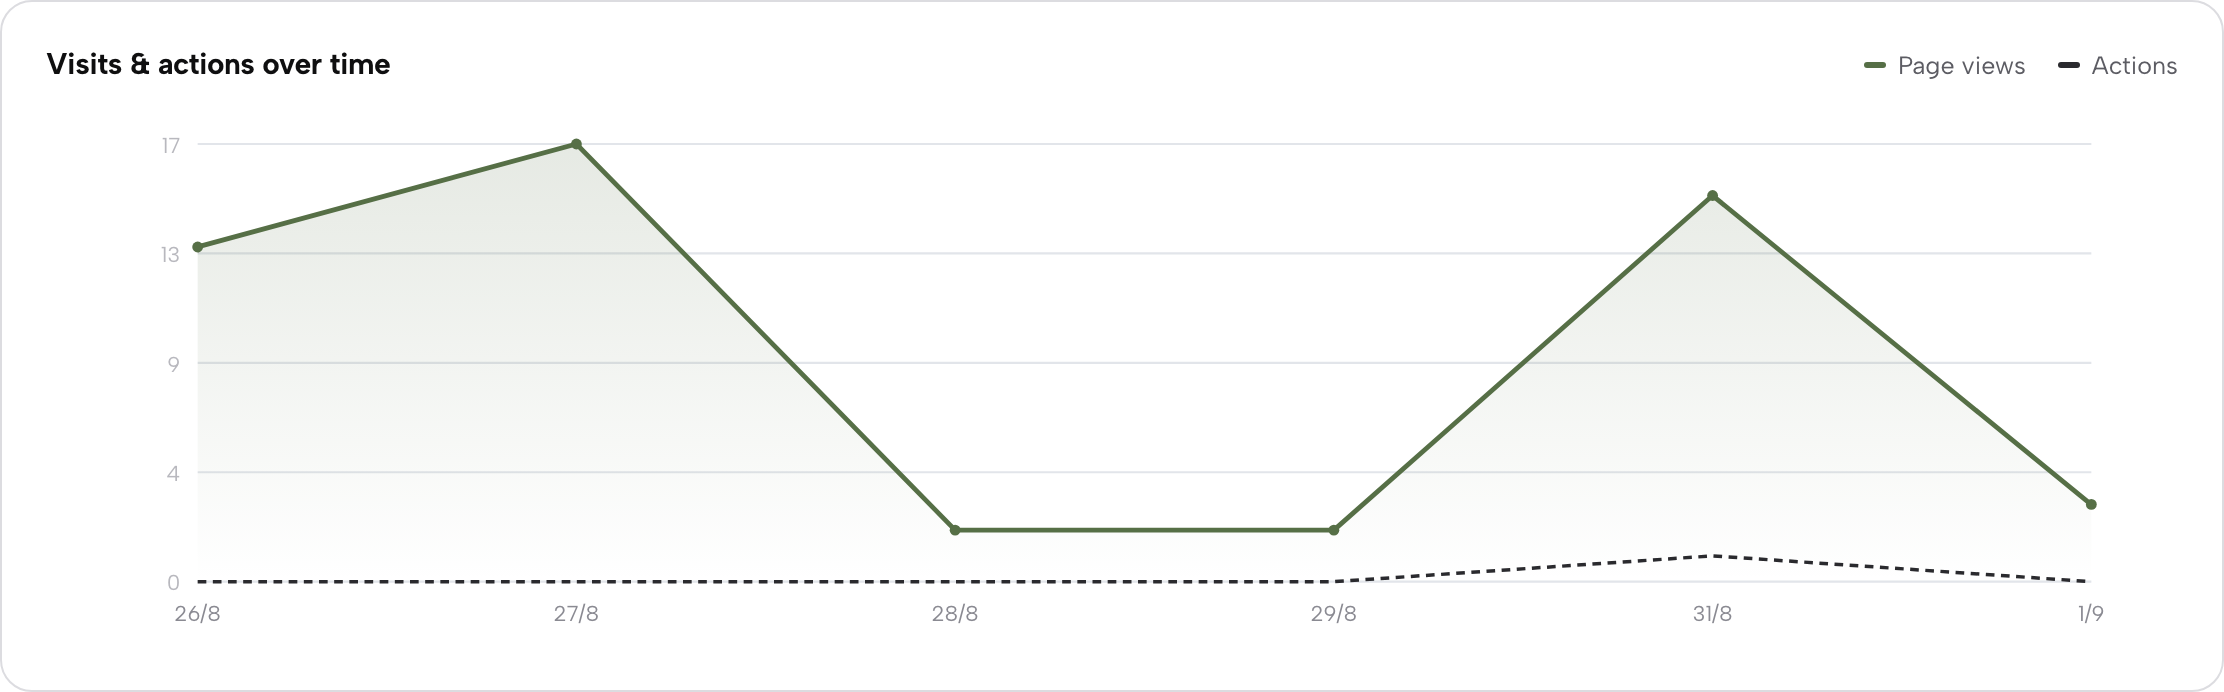
Beneath the cards, the Visits & actions over time chart plots a solid line for page views against a dashed line for actions — calls, directions and booking clicks combined — across every day in range. A brand-new site with no visits yet says “No visits recorded yet” with a View your live site link instead of pretending at a chart. These are the same four numbers as the dashboard’s “This week” cards — Analytics is where their history and context live.
Where visitors come from
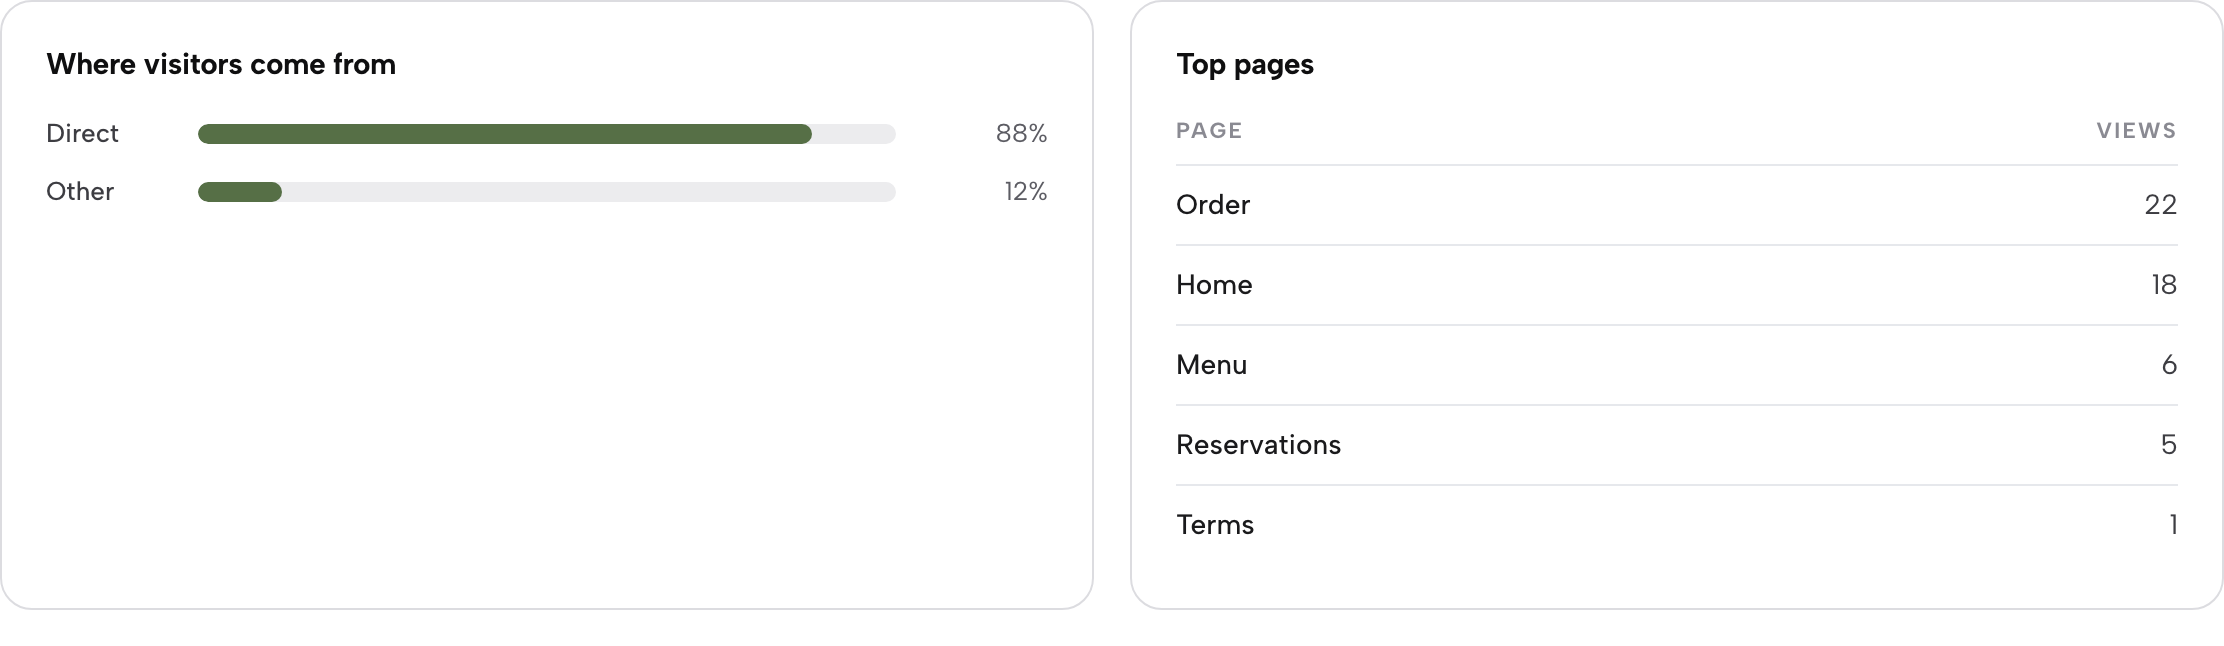
The Where visitors come from panel splits the window’s visits into four buckets by referrer: Search (arrived from Google, Bing, DuckDuckGo or Yahoo), Direct (typed your address or opened a bookmark), Social (Facebook, Instagram, TikTok, X, LinkedIn, Pinterest) and Other (any other site that linked to you). Only buckets with at least one visit appear — a quiet window might show just two bars.
Read it for what it is: a source split, not a keyword report. It tells you a visit came from a search engine, not what was typed into it. The useful weekly question is proportional — if nearly everything is Direct, guests who already know you are finding you, and search is where the room to grow is.
Top pages
Beside the sources sits Top pages: every page that received at least one view in the window, highest first, up to eight rows. The homepage is listed as Home; other pages take their names from their address — Menu, Order, Reservations. This is the quickest answer to “do guests actually reach the menu?” — the pages you care about should be near the top, and a page that never appears is a page no guest is finding.
The Operations report
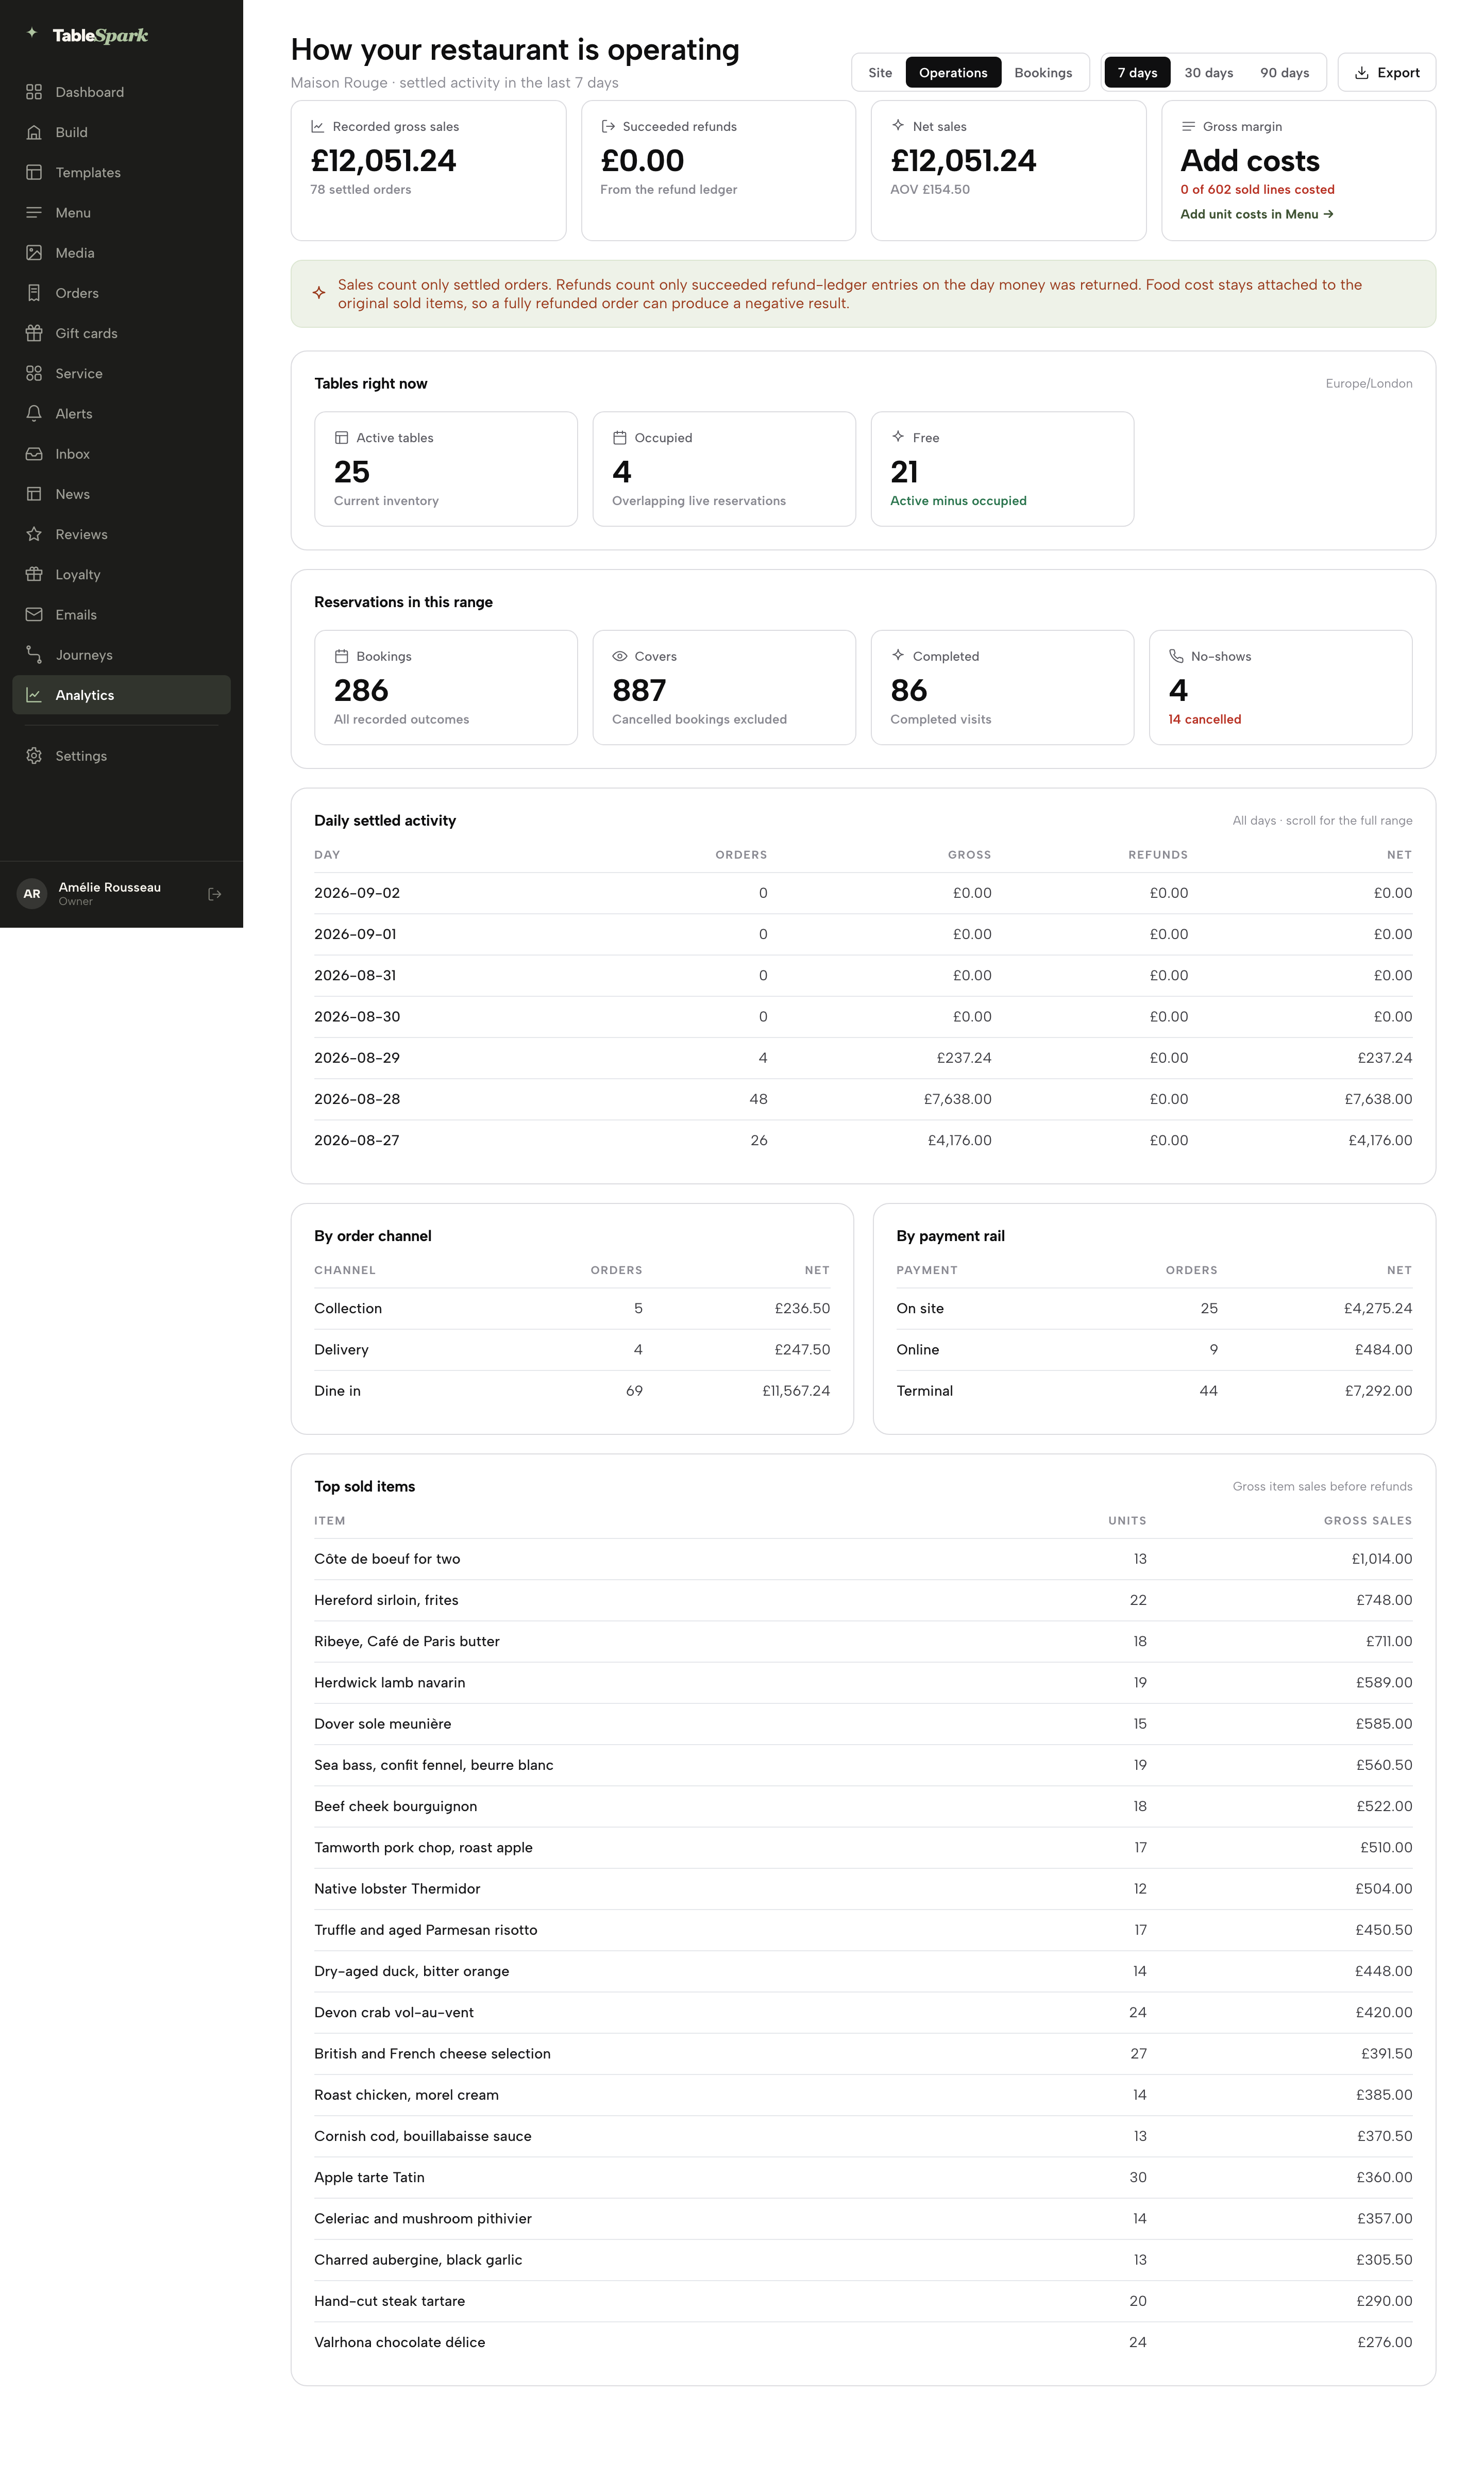
Click Operations and the page becomes “How your restaurant is operating” — money and floor, not clicks. Four cards lead: Recorded gross sales with the settled order count, Succeeded refunds, Net sales with the average order value, and the food-cost card — which says Add costs with a count of costed sold lines (“0 of 11,401 sold lines costed” on the demo) and an Add unit costs in Menu → link until every sold item carries a unit cost, then becomes Net after food cost with your gross margin. The accounting rule is printed right on the page: only settled orders count as sales, only succeeded refunds count as refunds, and food cost stays attached to the original order — so a fully refunded order can honestly show a negative result.
Below that, the floor and the book: Tables right now (active tables, occupied, free — on Europe/London time; with no tables set up it offers a Set up tables link), Reservations in this range (bookings, covers with cancellations excluded, completed visits, and no-shows with the cancelled count beneath), a scrollable Daily settled activity table of orders/gross/refunds/net per day, sales By order channel (dine in, collection, delivery) and By payment rail (on site, online, terminal), and a Top sold items ranking by gross sales. Export here downloads the whole operations report as one CSV.
The Bookings report
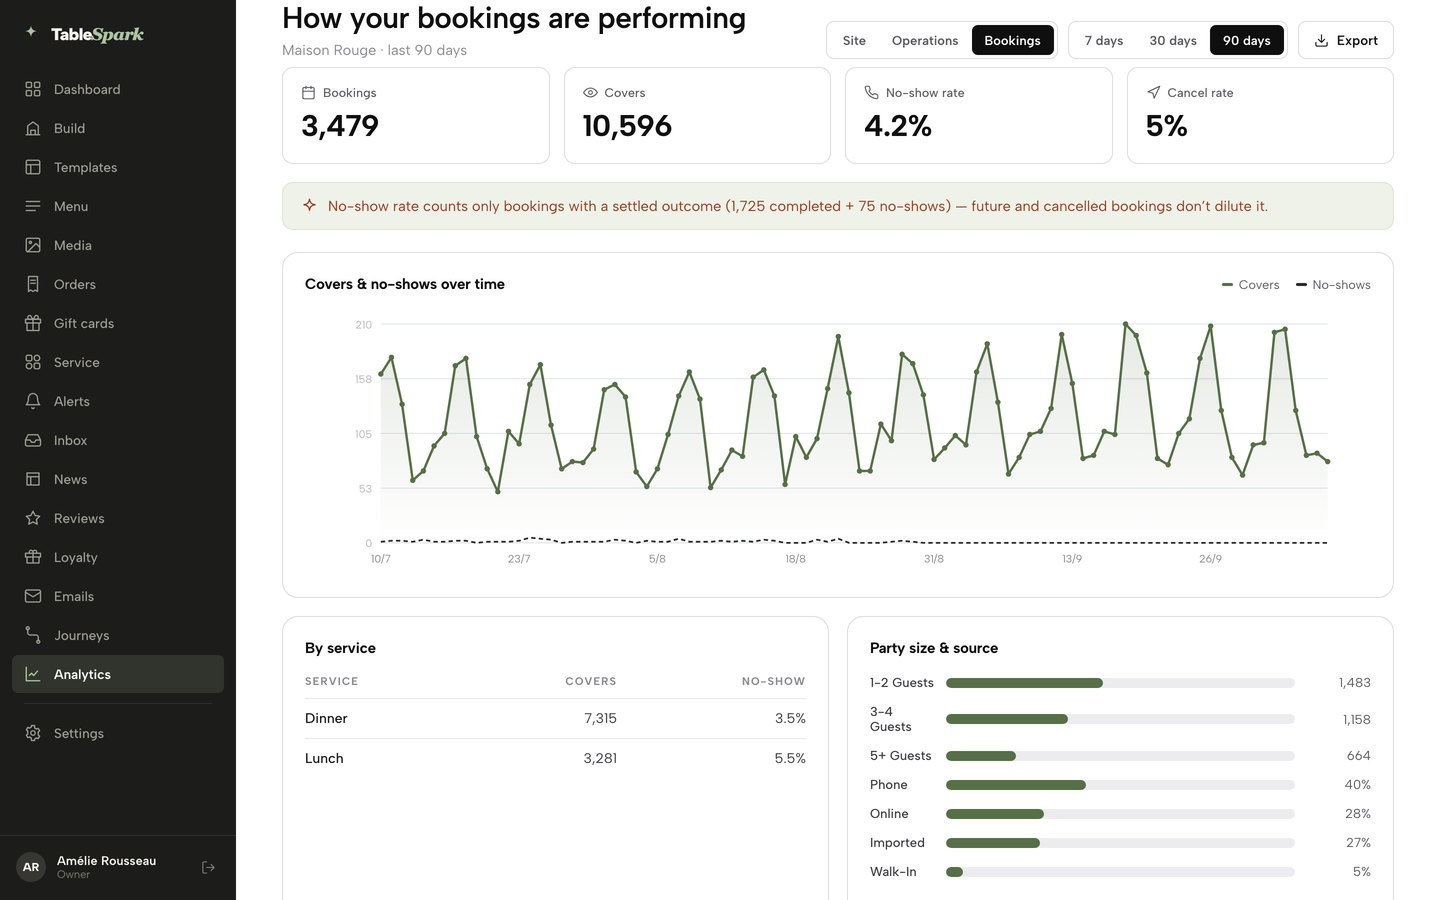
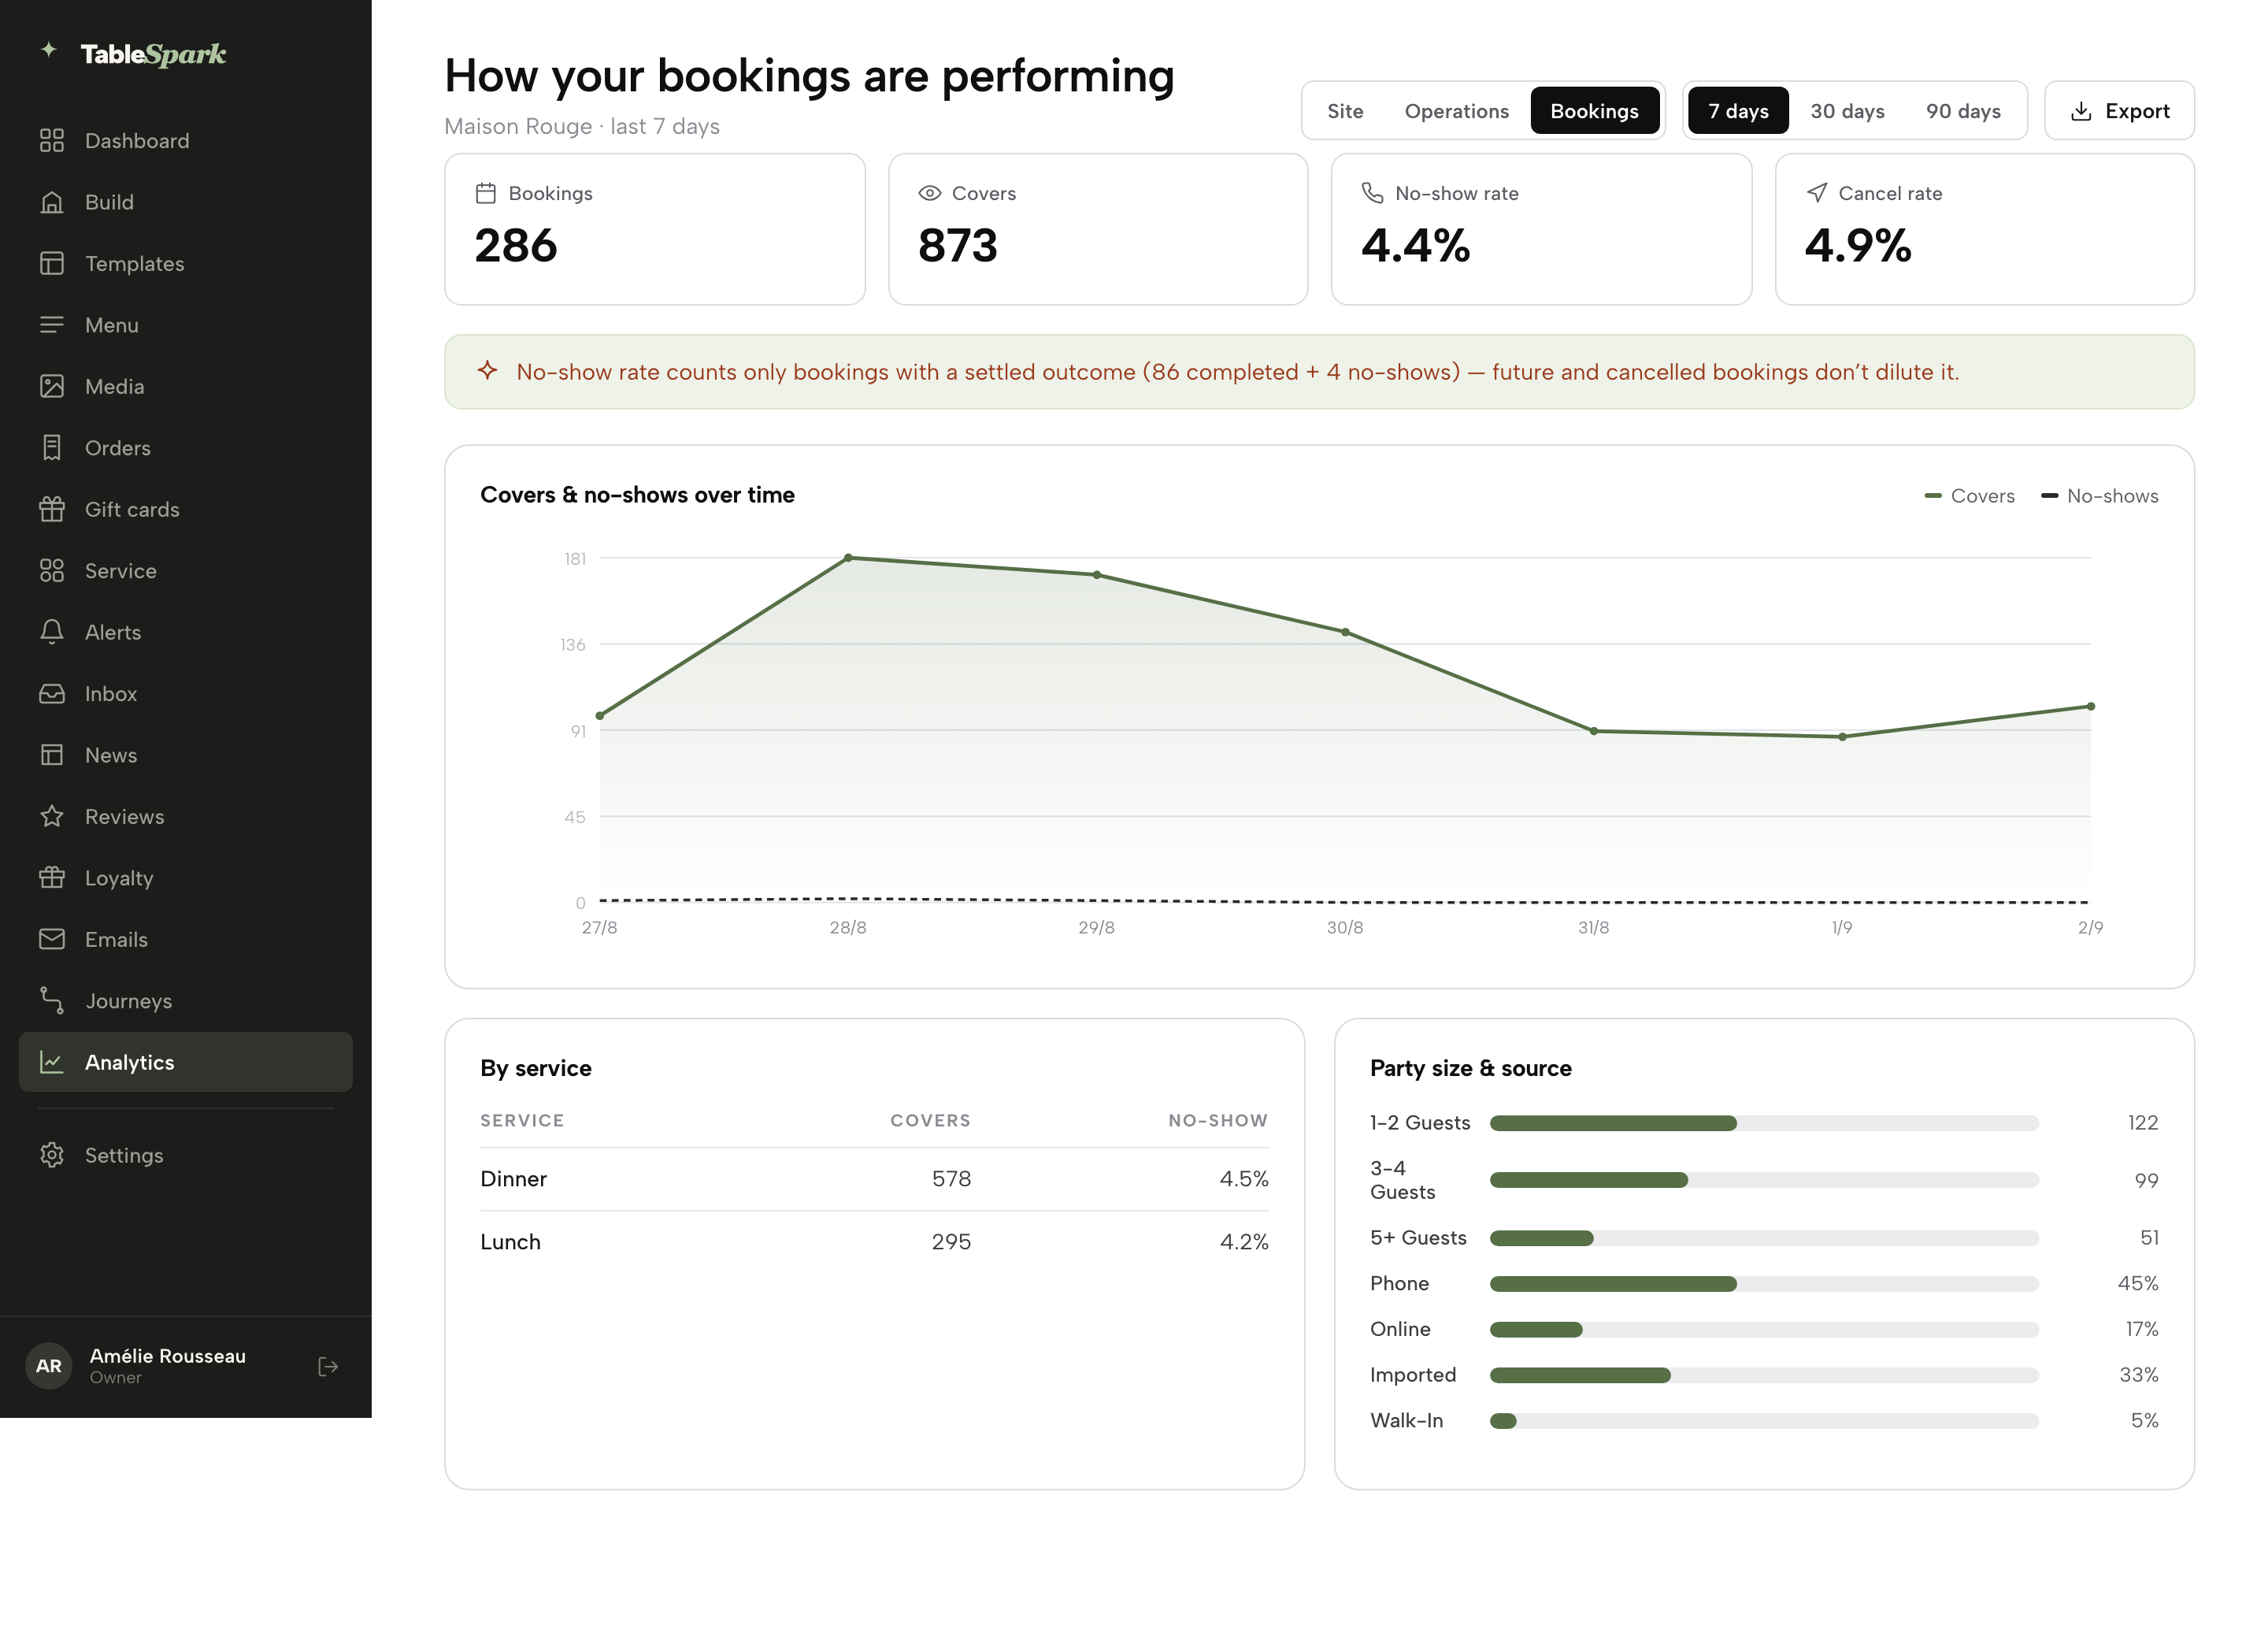
Click Bookings and the heading becomes “How your bookings are performing”. Four cards: Bookings, Covers, No-show rate and Cancel rate. The no-show rate’s denominator is stated on the page itself: it counts only bookings with a settled outcome — completed plus no-shows — so future and cancelled bookings never dilute it. A 4.2% rate means about 4.2% of the bookings that reached a settled outcome were no-shows.
The Covers & no-shows over time chart plots covers as a solid line against no-shows as a dashed one. By service splits covers and no-show rate per sitting — lunch behaving differently from dinner is exactly the kind of thing this table surfaces — and Party size & source breaks the window’s bookings into 1–2 / 3–4 / 5+ guests and into how they arrived: online, phone, imported, walk-in. If deposits or card guarantees are on the table for quiet-night no-shows, guide 06 covers switching them on.
The five-minute habit
Once a week, same day each week: open Analytics, leave the range on 7 days. Read the one-line summary and the four trend arrows on Site — is anything down that shouldn’t be? Glance at Where visitors come from and Top pages for anything unexpected. If you take orders online, flip to Operations and read net sales and refunds for the week. If you take reservations, flip to Bookings and read the no-show rate. That’s the whole habit — five minutes, and you know whether the machine is working. For the same four site numbers without opening Analytics at all, the dashboard’s This week cards greet you at every sign-in.
And the measurement behind all of it is deliberately clean: first-party and cookieless. It records the action type, the page, a coarse source and device type, and a random identifier held in the visitor’s own browser — no IP address, no precise location, no tracking across other websites. Your numbers, from your site, about your guests — and nothing else’s.
Done · the whole path, walked
Open your own numbers
Site first, Operations if you sell, Bookings if you seat — five minutes, once a week.