UK restaurant website statistics 2026.
We audited 1,000 independent restaurant websites.
DOIBased on Zheng, K. (2026). Search Readiness and Direct-Booking Infrastructure on Independent Restaurant Websites in the United Kingdom. Zenodo preprint.10.5281/zenodo.23306547A guest searches a restaurant's name on a phone and finds a directory, a delivery marketplace that charges commission on every order and a competitor two streets away before the restaurant's own site. The site is live, it loads, and nothing looks wrong to the owner. In an audit of 1,000 independent UK restaurant websites, the typical site had five problems flagged, and only 1.2% of the homepages that loaded passed every check.
A random sample of 1,000 independent UK restaurant websites was audited on 11 and 12 October 2026. 17.9% of the domains were gone, unreachable or broken. Of the 755 homepages that loaded, 77.1% had no usable Restaurant structured data, 31% had no meta description, 22.1% showed no menu, 25.6% had no booking link and 54.7% had no tap-to-call link. The median site had 5 issues flagged by the checker, and only 16.8% had all five core basics.
Executive summary
The general web plumbing on UK restaurant websites is roughly as good as the web as a whole. The part that is specific to a restaurant, the part that tells Google and a hungry guest what the place is, what it serves and how to book, is mostly missing.
- Almost one in five listed websites was gone or broken. 179 of the 1,000 domains (17.9%) no longer resolved, could not be reached or returned an error.
- The general basics are at web-average levels. 69% of loaded homepages had a meta description and 95.4% a mobile viewport, close to the 67.2% and 95.2% the Web Almanac 2025 found across all mobile pages.
- The restaurant layer is missing. 77.1% had no usable Restaurant structured data. Of the 212 sites that had a restaurant-type block, only 26.9% included the menu and 36.3% the cuisine.
- Menus are hard to read. 21.9% of homepages linked to no menu at all and 10.4% linked straight to a PDF. Of the menu pages that were web pages, only 32.5% showed at least three prices as text, and 3% carried menu structured data.
- Booking and ordering leave the site. 25.6% had no booking link, 18.4% sent guests to another company's site to book and 13.4% sent ordering to a delivery marketplace.
- The details a guest needs on a phone are patchy. 54.7% had no tap-to-call link, 45.3% showed opening hours in the page text, and 9.2% mentioned allergens on the homepage.
- Speed and JavaScript are not the main problem. In a lab test, 9.4% of homepages took longer than 2.5 seconds to show their largest element, and rendering JavaScript changed the structured data result for only 2.1% of sites without it.
- The typical site has five fixable gaps. The median homepage had 5 issues flagged. 1.2% had none, and 16.8% had all five core basics.
Why restaurant websites matter in 2026
The UK had 108,500 enterprises in restaurants and mobile food service in 2026, according to the ONS UK Business Counts, up from 102,450 in 2024. 84,270 of them, about 77.7%, employed fewer than ten people. Those are the businesses this study is about: independent restaurants where the owner is also the person who has to keep the website right.
Their guests are on phones and on Google. Ofcom's Online Nation 2025 report, published on 10 December 2025, found that smartphones accounted for 77% of the time UK online adults spent online on the average day, that 82% of UK online adults used Google Search in the month, and that the Google Maps smartphone app reached 77% of adults. A restaurant's own website is one tap away from the map listing, and one tap away from every alternative.
The alternatives charge for it. Uber Eats' UK merchant pricing page lists a 30% fee on delivery orders, 13% on pickup and self-delivery orders, and an initial fee of £650 excluding VAT. A guest who is unable to find the menu, book or order on the restaurant's own site does not stop wanting dinner. The guest goes somewhere that makes it easy, and that place either takes a cut or takes the booking.
A website can be live at a working link and still be absent from Google. A leftover noindex, a canonical that points elsewhere or a page that nothing links to can each leave an important page undiscovered or excluded, and missing restaurant data leaves Google to guess what the business is. The owner who checks the site in a browser sees nothing wrong.
How the study was done
Sample. A seeded random draw (seed 20261011) of 1,000 independent restaurants from TableSpark's August 2026 list of UK restaurants, built from OpenStreetMap entries tagged as restaurants that carry a website, across 106 UK areas. Chain signals were excluded, each domain was counted once, and links to social profiles and marketplaces were removed.
First pass, 11 October 2026. Each homepage was checked with the engine behind TableSpark's free restaurant website checker: the HTML as delivered without running JavaScript, the robots.txt file and the sitemap. The engine runs 16 core checks in three groups, reach, understand and act, plus a few conditional checks that appear only when they find a problem, such as a marketplace ordering link, and gives a score out of 100.
Second pass, 12 October 2026. Each of the 755 homepages that loaded was read again in more detail. The pass recorded which properties a restaurant structured data block carried, followed the menu link one step to see what the guest gets, and rendered the page in a headless Chromium browser at phone size to measure what JavaScript adds and how fast the largest element appeared. 753 homepages could be read in detail and 746 rendered.
Reporting. Percentages are shares of the 755 homepages that loaded unless a different base is given. Every share in the data appendix carries a 95% confidence interval; for a share near 50% of 755 sites, the interval is about plus or minus 3.6 percentage points. Results are reported as aggregates. No restaurant, domain or platform is named.
Full paper. The method, the statistical tests and the anonymised site-level data are published as a research preprint: Zheng, K. (2026), Zenodo, doi:10.5281/zenodo.23306547. This white paper presents its findings for restaurant owners.
| Measure | Counted as missing when |
|---|---|
| Usable Restaurant data | No Restaurant or LocalBusiness block with a name and an address |
| Sitemap | No sitemap the checker could read at the usual address or in robots.txt |
| Menu | No link or text on the homepage that leads to a menu |
| Booking link | No link or button on the homepage that leads to booking |
| Tap to call | No telephone link a phone can dial with one tap |
| Thin text | Fewer than 120 words readable in the page as delivered |
Almost one in five listed websites was gone or broken
- 755Loaded
- 89Domain gone
- 56Error status
- 34Unreachable
- 61Firewall, excluded
- 5Invalid, excluded
Source: TableSpark UK restaurant website study, October 2026. All 1,000 sampled domains.
Of the 1,000 domains, 755 loaded with a normal page. 89 domains no longer resolved at all, 34 were unreachable or timed out, and 56 returned an error status instead of a page. A further 61 turned the checker away with a firewall challenge and 5 were invalid addresses; those 66 were excluded from every percentage, because a site that blocks automated visitors may still work for a guest.
That leaves 179 domains, 17.9% of the sample, that were gone, unreachable or broken when the check ran. OpenStreetMap listings can be out of date, so some of those restaurants may have moved address. For the guest holding the listing, the result is the same: the link they were given does not work, and the next tap is a directory or a competitor.
The general basics are at web-average levels
- Restaurant homepages, this study
- All mobile pages, Web Almanac
Sources: TableSpark study, 755 loaded homepages; HTTP Archive Web Almanac 2025 (SEO), 2024 (structured data). Different populations; a guide, not a ranking.
On the generic parts of a web page, independent restaurant homepages were close to the web as a whole. The HTTP Archive's Web Almanac 2025 measured mobile pages across the web; restaurant homepages in this study sat near its figures, and ahead on some.
- 69% of loaded homepages had a meta description, against 67.2% of mobile pages in the Web Almanac 2025.
- 77.9% named a canonical address, against 67%.
- 95.4% declared a mobile viewport, against 95.2%.
- 64.6% had a main heading, against 70%.
- 0.8% carried a noindex rule, against 2.4%.
- 59.6% carried structured data of some kind, against 41% of pages in the Web Almanac 2024.
The two studies count different things, all mobile pages against restaurant homepages, so the comparison is a guide, not a ranking. The point it makes is plain enough: restaurant sites are not unusually badly built. The gaps that matter are the ones a general website template does not fill on its own.
The restaurant layer is missing
- Estimate
- 95% interval
Source: TableSpark UK restaurant website study, October 2026. n = 755 loaded homepages; 95% Wilson intervals.
Restaurant structured data is a short block of code that states, in a form search engines read directly, that the page belongs to a restaurant, with its name, address, telephone number, opening hours, cuisine and menu. Google's guidance on local business data lists name and address as required, and menu, servesCuisine, openingHoursSpecification and telephone among the recommended properties.
- 77.1% of loaded homepages had no usable Restaurant structured data.
- 71.9% had no restaurant-type block at all, and a further 5.2% had one missing the name or the address.
- 13.8% had a complete block with name, address, telephone, hours, cuisine and menu.
Most of the structured data that was present described something else. The most common types were WebSite (51.9% of homepages read in detail), WebPage (28.2%) and Organization (24.7%), the kind of block a general website template adds by default. Restaurant itself appeared on 15.8%, and LocalBusiness on 12%.
Source: TableSpark UK restaurant website study, October 2026. n = 212 homepages with a restaurant-type block; 95% Wilson intervals.
Even where a restaurant-type block existed, it usually stopped at the basics. Of the 212 homepages that had one, 85.8% gave the name and 82.1% the address, but 66% gave a telephone number, 65.6% opening hours, 36.3% the cuisine and 26.9% the menu. Only 35.4% said whether the restaurant accepts reservations.
Google can still work out a lot from the page text and from the business profile, and structured data does not guarantee any particular result. A restaurant that leaves it out, or fills in only the name, is leaving Google to guess the details that guests search for: the cuisine, the menu and the hours.
Booking and ordering leave the site
Source: TableSpark UK restaurant website study, October 2026. n = 755 loaded homepages.
- 25.6% of loaded homepages had no booking link at all.
- 18.4% sent guests to another company's website to book.
- 13.4% sent ordering to a delivery marketplace.
- 12.6% both took bookings on their own site and carried usable Restaurant data.
Each external link moves the moment of decision off the restaurant's own site and takes the guest's details with it. On a marketplace, the restaurant is one listing among many, and the fee is taken from every order: the 30% delivery fee on Uber Eats' UK merchant pricing page is the published example.
The details a guest needs on a phone are patchy
Almost every site had the basic mobile setting in place: 4.6% had no mobile viewport. The trouble was in the details a guest looks for while walking.
- 54.7% had no tap-to-call link in the page as delivered, and 47.9% still had none after JavaScript ran.
- 45.3% showed opening hours in the homepage text.
- 73% showed a UK postcode, and 71.4% a phone number, in the homepage text.
- 39.6% linked to a map.
- 5.9% were wider than a phone screen, so the guest has to scroll sideways.
Images were often unlabelled for screen readers and search engines. 40.2% of all images on the homepages had no alt text, and 76.8% of homepages with images had at least one without it. Only 31.9% declared the page as British English.
Speed and JavaScript are not the main problem
Source: TableSpark UK restaurant website study, October 2026. n = 741 homepages with a measurement; one unthrottled run each, headless Chromium. Number of homepages per band.
Speed is the gap most owners worry about, and in this study it was the smallest. Rendered once at phone size on a fast connection, the median homepage showed its largest element in 0.57 seconds. 9.4% took longer than 2.5 seconds, the threshold web.dev sets for a good Largest Contentful Paint, and 2% took longer than 4 seconds. These are single lab measurements, not the field data Google collects from real visitors on real networks, so a guest on one bar of signal will wait longer.
JavaScript did not change the main findings either. Google can render JavaScript, so text or data added by scripts may still be read. After rendering, 25.4% of the homepages that had fewer than 120 words as delivered reached 120 words, and only 2.1% of homepages without restaurant structured data gained it. The missing restaurant layer is missing from the page, not hidden behind a script.
The typical site has five fixable gaps
Source: TableSpark UK restaurant website study, October 2026. n = 755 loaded homepages. Number of homepages by count of issues flagged (16 core checks plus conditional checks).
The checker runs 16 core checks on every homepage, plus conditional checks that appear only when they find a problem. The median site had 5 issues flagged, and the middle half had between 3 and 6. 1.2% had none, and 18.9% had 7 or more.
The study also counted a homepage as having the core basics if it had all five of these: usable Restaurant structured data, a sitemap the checker could read, no noindex rule, a mobile viewport, and a menu link or menu text on the homepage. Only 16.8% of the 755 loaded homepages had all five.
The checker's score out of 100 tells the same story more gently. The median was 81, and the middle half of sites scored between 76 and 86. A score in the 80s looks reassuring, and that is the trap. Most sites pass the checks that are easy to see, such as HTTPS and a mobile layout, and fail the ones nobody sees: the structured data, the description, the sitemap, the menu as text. The site looks finished to the owner, so nobody looks again.
Where the gaps differ: London, regions and cuisines
- London
- Rest of UK
Source: TableSpark UK restaurant website study, October 2026. London n = 267, rest of UK n = 488 loaded homepages.
The sample held 267 loaded homepages in London and 488 elsewhere in the UK. Their average scores were close, 81 and 80, but the gaps were different.
| Gap | London (267) | Rest of UK (488) |
|---|---|---|
| No usable Restaurant structured data | 74.9% | 78.3% |
| No readable sitemap | 13.9% | 23.6% |
| No meta description | 26.6% | 33.4% |
| Booking sent to another company's site | 29.2% | 12.5% |
| Ordering sent to a delivery marketplace | 16.5% | 11.7% |
| No tap-to-call link | 57.3% | 53.3% |
London sites were better on the technical basics and far more likely to hand the booking to someone else: 29.2% sent guests to another company's site to book, more than twice the share outside London. Outside London, the bigger risk is the technical gap: almost one in four sites had no sitemap the checker could read, and a third had no description.
Cuisine is a rough grouping, taken from the OpenStreetMap listing, and the groups below are the six with at least 25 loaded homepages. Small groups move a lot with a few sites, so read these as patterns, not league tables.
| Cuisine | No booking link | Ordering via marketplace | No tap-to-call |
|---|---|---|---|
| Chinese (40) | 57.5% | 7.5% | 65% |
| Pizza (25) | 36% | 28% | 48% |
| Thai (29) | 34.5% | 17.2% | 65.5% |
| Indian (104) | 30.8% | 11.5% | 51.9% |
| Japanese (28) | 28.6% | 32.1% | 82.1% |
| Italian (87) | 17.2% | 12.6% | 51.7% |
Chinese restaurants were the most likely to have no booking link, 57.5%, and also had the most missing sitemaps of the six (37.5%). Japanese and pizza restaurants leaned hardest on marketplaces, at 32.1% and 28%. Structured data was missing across every cuisine, from 75% to 82.8%.
The same was true by website platform. Among the platforms the checker could identify on at least 30 homepages, the share without usable Restaurant structured data ran from 36.8% to 88.7%. No general website platform in the sample had solved it for restaurants by default. Building a site on a general builder gets a page online. It does not, on this evidence, get the restaurant described to search engines.
What good looks like
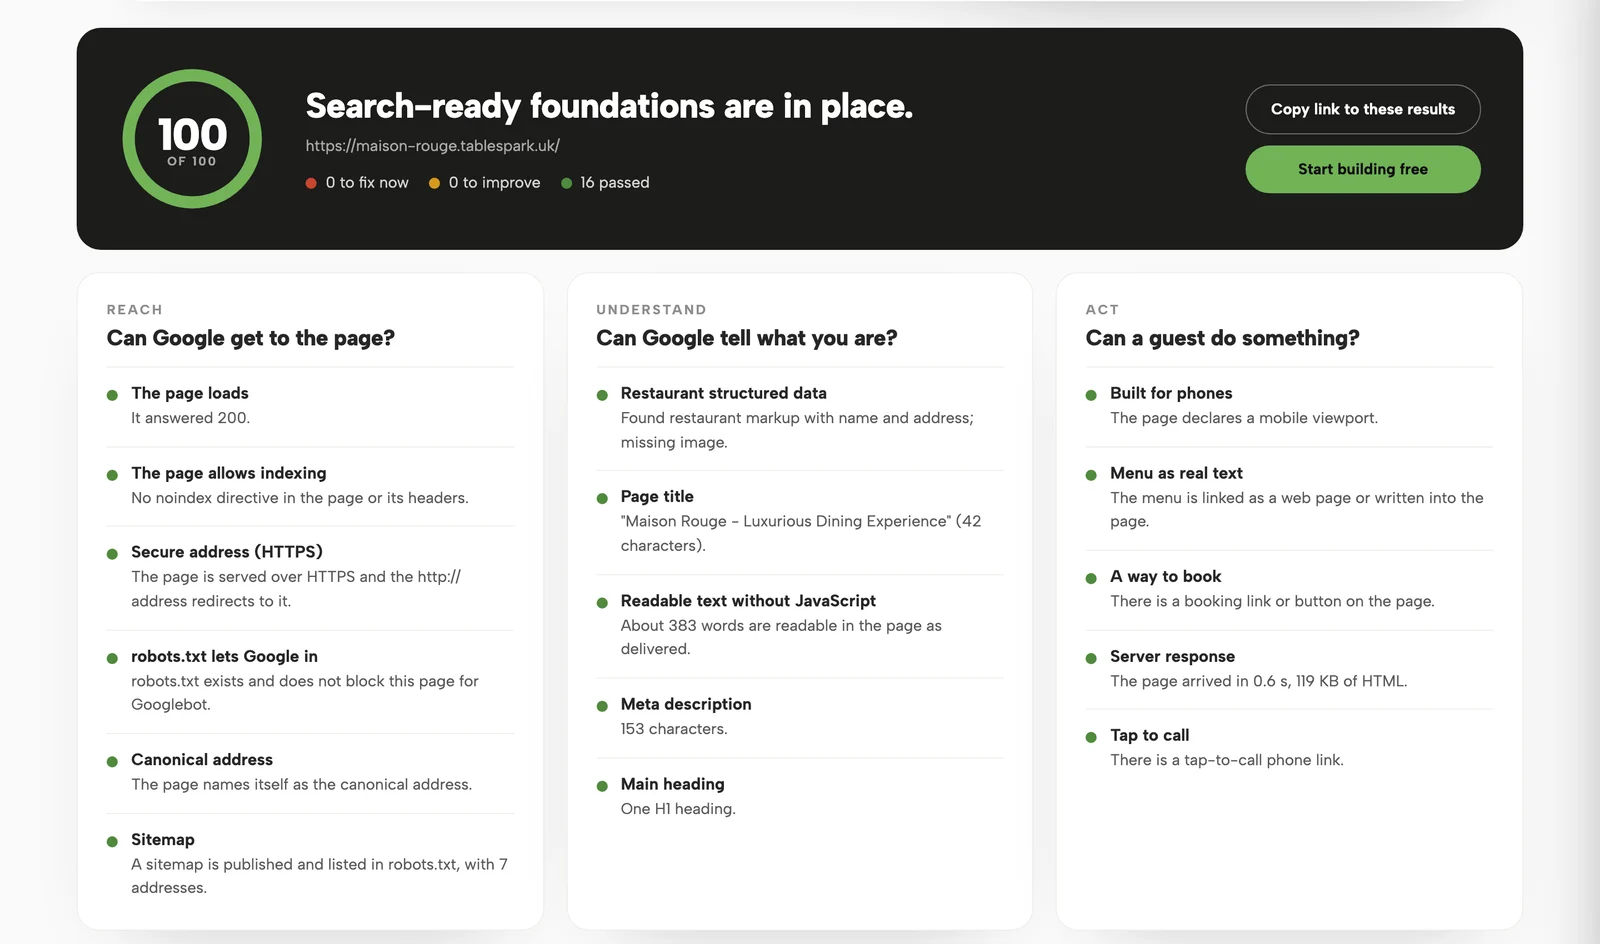
The same checker run against a restaurant site built on TableSpark, the Maison Rouge demonstration site, passes all 16 checks and scores 100. Every item the study found missing is in place: the Restaurant data, the sitemap listed in robots.txt, the canonical address, the description, the menu as text, the booking link and the tap-to-call button.
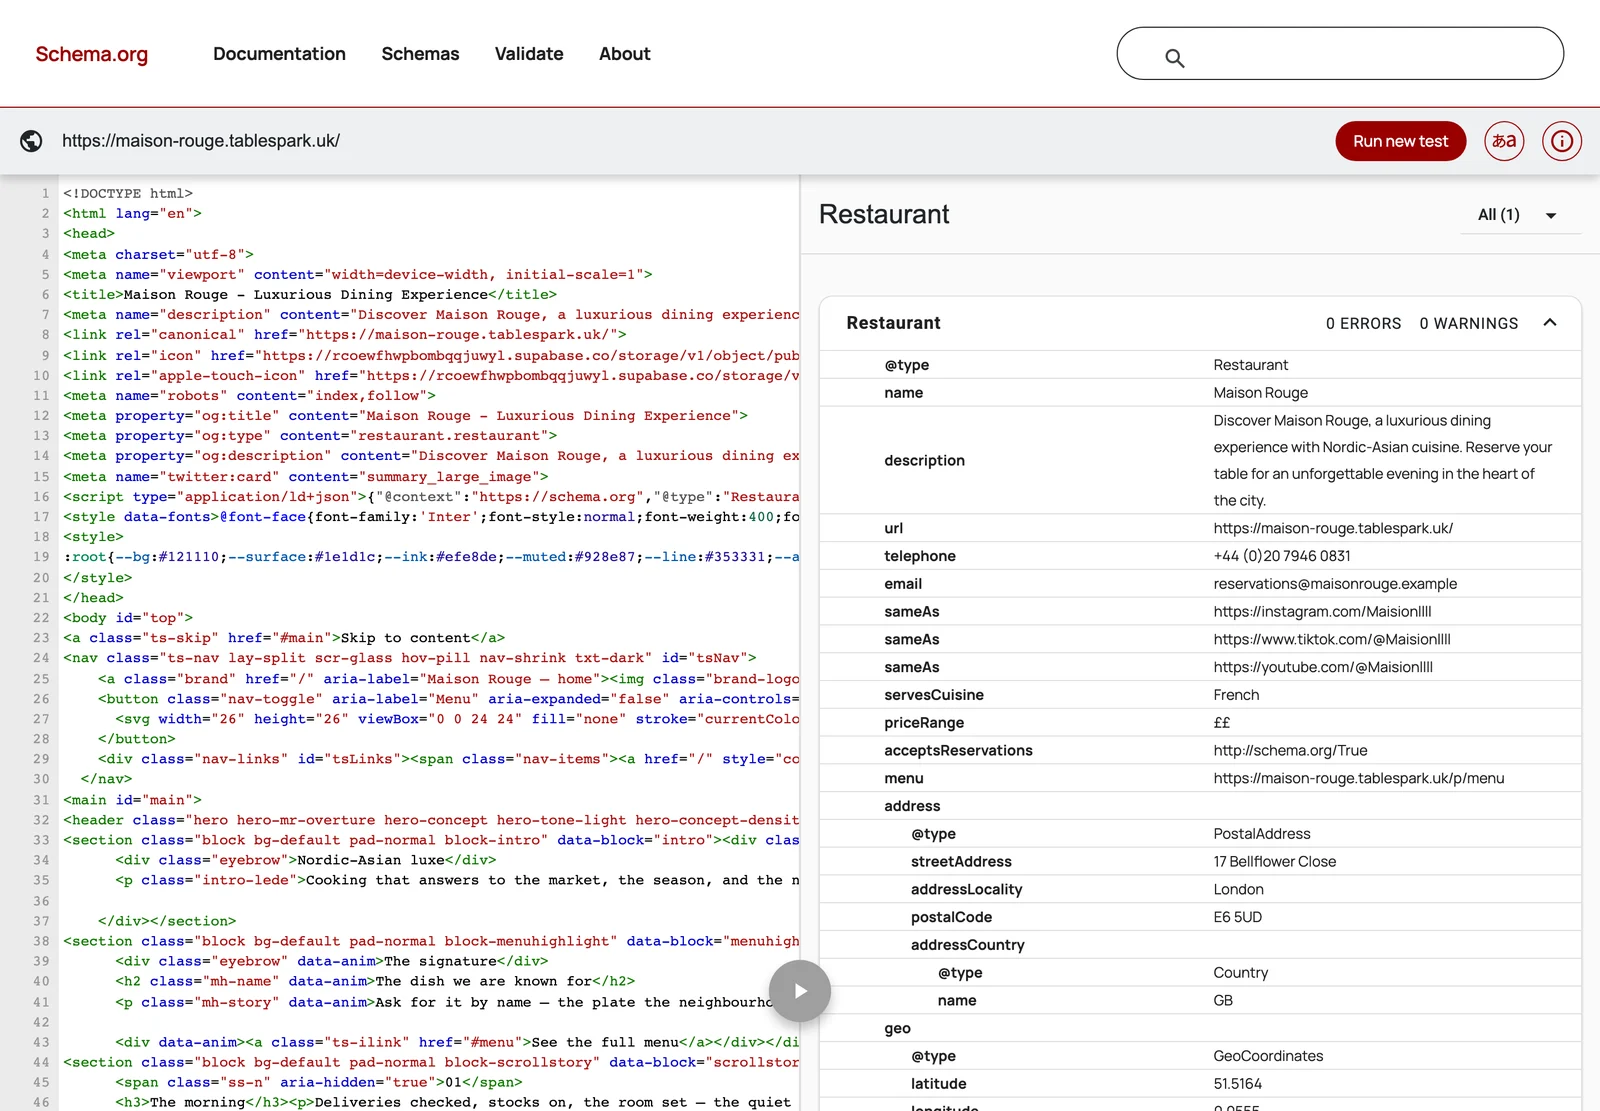
Schema.org's own validator reads the same homepage as a Restaurant with no errors and no warnings, carrying the name, address, telephone, cuisine, price range, reservations, geo coordinates, opening hours and the menu, with every dish and price beneath it.
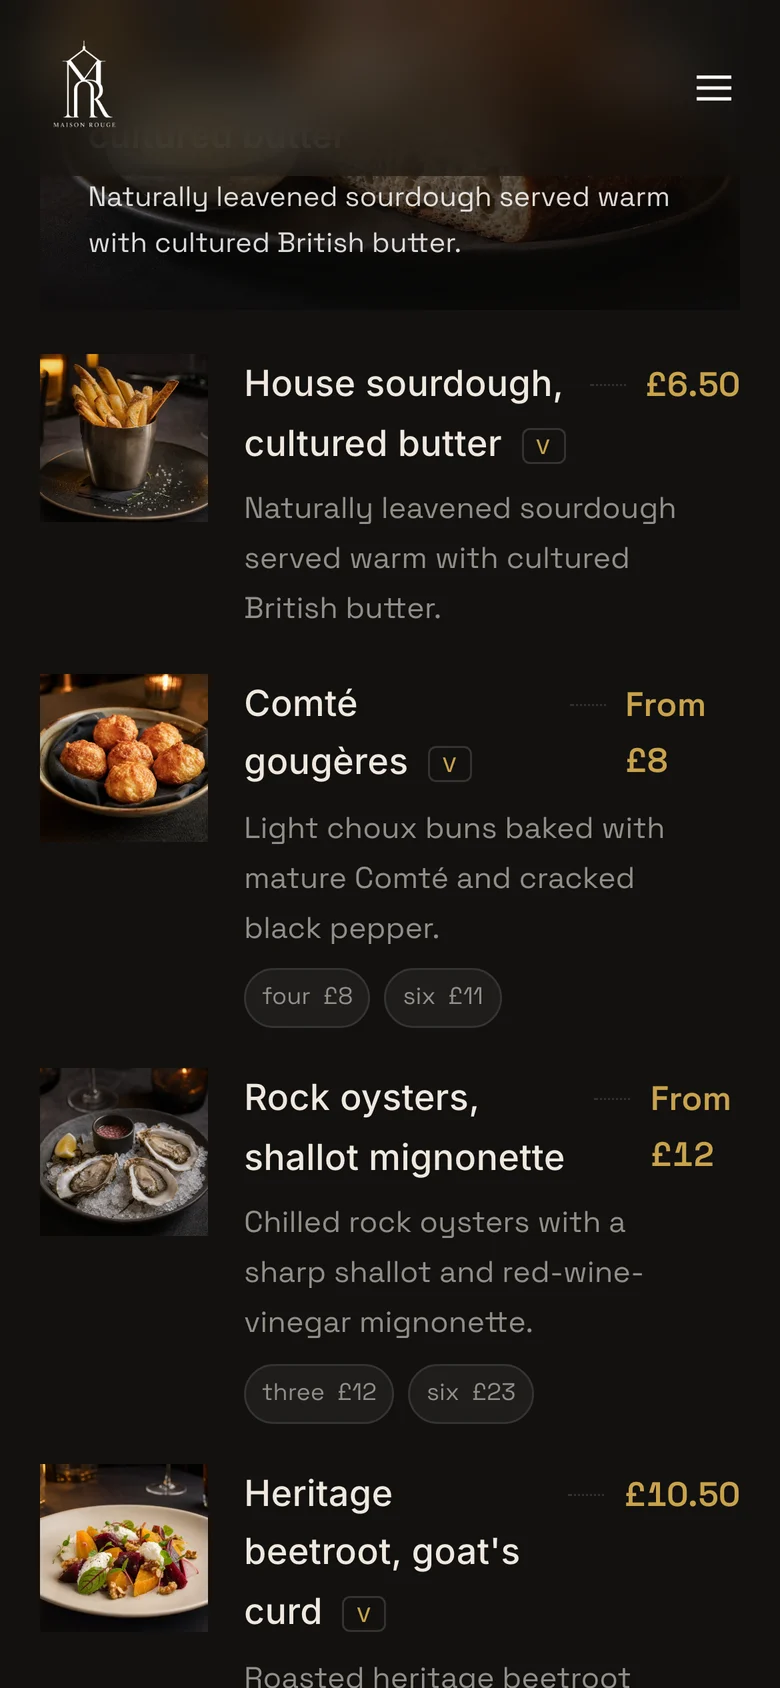
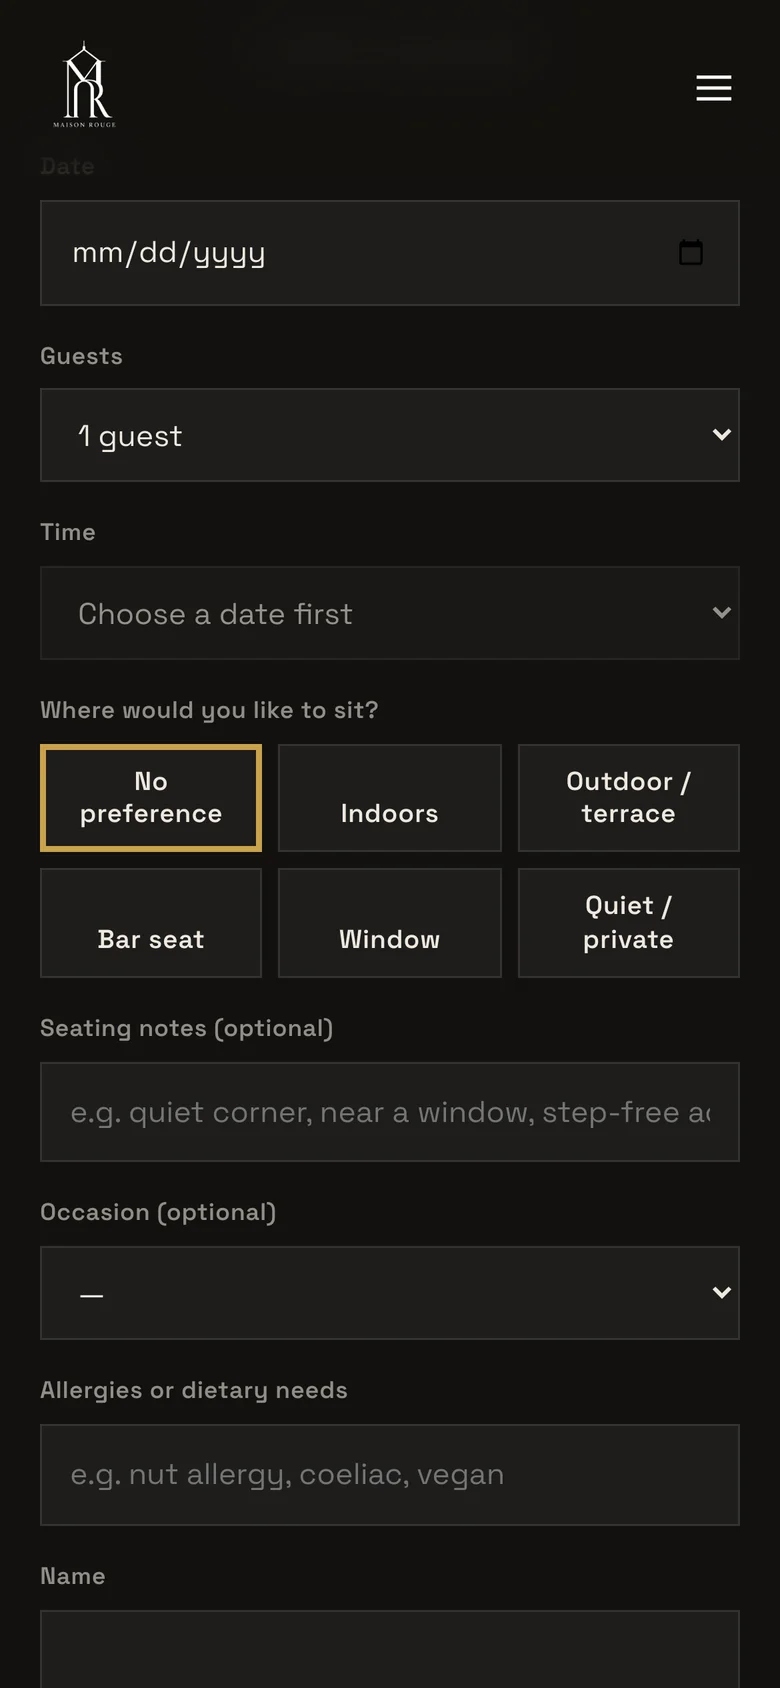
On a phone, the menu is a web page: each dish has its name, description, dietary tags and price as text, so a guest can read it without downloading a file and a search engine can read the same words. The booking form sits on the restaurant's own site and asks for the date, party size, time, seating preference and any allergies or dietary needs.
Action plan for restaurant owners
The order below follows the damage. A gap that stops Google seeing the page outranks one that only makes it harder to read.
| Fix | Why it matters | Missing on |
|---|---|---|
| Check the site loads at the listed address | A dead link sends the guest to the next result | 17.9% of domains |
| Add Restaurant structured data with menu and cuisine | States what the business is, in Google's terms | 77.1% of homepages |
| Put the menu on the page as text | Readable on a phone and by search | 21.9% had no menu link |
| Take bookings on the restaurant's own site | Keeps the guest and the guest's details | 25.6% had no booking link |
| Add a tap-to-call link to every page | One tap from search to a phone call | 54.7% of homepages |
| Write a meta description that names the town | Gives Google a summary to show | 31% of homepages |
| Publish a sitemap and list it in robots.txt | Tells Google about every page | 20.1% of homepages |
The fastest way to see where one site stands is to run it through the free website checker. It takes about ten seconds, needs no sign-up, and lists each of the 16 checks with a plain fix for anything it finds. The full list of what a restaurant site should carry is in the restaurant website checklist, and the search side is covered in restaurant SEO in the UK and getting a restaurant website on Google.
Method and limits
The limits matter, and most of them point the same way: the study may miss things a site does have.
- Homepage first. The first pass read the homepage only. The second pass followed the menu link one step; booking pages and other pages were not read.
- HTML as delivered, then rendered. The first pass did not run JavaScript. The second pass rendered each page once in headless Chromium at phone size, which is closer to what Google sees but is not Google's own renderer.
- Lab speed. Load times come from one run on a fast connection, not from field data, and understate what a guest on a slow network waits.
- Firewalls excluded. 61 sites that turned the checker away were left out, and they may be in better or worse shape than the rest.
- Listings can be out of date. A domain that no longer resolves may belong to a restaurant that has moved address, or closed.
- Text patterns are approximate. Prices, opening hours, postcodes and allergen mentions were found by pattern matching, which can miss unusual formats.
- Benchmarks count different things. The Web Almanac measures all mobile pages on the web; this study measures independent restaurant homepages.
No individual restaurant is named in this report, and none will be. The figures are aggregates only. Anyone is welcome to cite them with a link to this page.
Data appendix
Every share below is of the loaded homepages unless the base says otherwise, with a 95% Wilson confidence interval. The restaurant block rows are shares of the 212 homepages that had one. The anonymised site-level data, the codebook and the analysis code are in the Zenodo deposit.
| Measure | Share | 95% interval | Sites |
|---|---|---|---|
| Usable Restaurant structured data missing | 77.1% | 74–79.9% | 582 of 755 |
| Meta description missing | 31% | 27.8–34.4% | 234 of 755 |
| Canonical address missing | 22.1% | 19.3–25.2% | 167 of 755 |
| Readable sitemap missing | 20.1% | 17.4–23.1% | 152 of 755 |
| Noindex rule present | 0.8% | 0.4–1.7% | 6 of 755 |
| Main heading missing | 35.4% | 32–38.8% | 267 of 755 |
| Under 120 words as delivered | 17.4% | 14.8–20.2% | 131 of 755 |
| No menu found on homepage | 22.1% | 19.3–25.2% | 167 of 755 |
| Menu offered only as a PDF | 10.1% | 8.1–12.4% | 76 of 755 |
| No booking link | 25.6% | 22.6–28.8% | 193 of 755 |
| Booking on another company's site | 18.4% | 15.8–21.3% | 139 of 755 |
| Ordering via a delivery marketplace | 13.4% | 11.1–16% | 101 of 755 |
| No tap-to-call link | 54.7% | 51.1–58.2% | 413 of 755 |
| No mobile viewport | 4.6% | 3.4–6.4% | 35 of 755 |
| Restaurant block has name | 85.8% | 80.5–89.9% | 182 of 212 |
| Restaurant block has address | 82.1% | 76.4–86.7% | 174 of 212 |
| Restaurant block has telephone | 66% | 59.4–72.1% | 140 of 212 |
| Restaurant block has opening hours | 65.6% | 58.9–71.6% | 139 of 212 |
| Restaurant block has cuisine | 36.3% | 30.1–43% | 77 of 212 |
| Restaurant block has accepts reservations | 35.4% | 29.3–42% | 75 of 212 |
| Restaurant block has menu | 26.9% | 21.4–33.2% | 57 of 212 |
| Opening hours in page text | 45.3% | 41.8–48.9% | 341 of 753 |
| UK postcode in page text | 73% | 69.8–76.1% | 550 of 753 |
| Allergens mentioned | 9.2% | 7.3–11.4% | 69 of 753 |
| Map link | 39.6% | 36.1–43.1% | 298 of 753 |
| Page declared as British English | 31.9% | 28.6–35.3% | 240 of 753 |
| Wider than a phone screen | 5.9% | 4.4–7.8% | 44 of 746 |
| Largest Contentful Paint over 2.5 s (lab) | 9.4% | 7.5–11.8% | 70 of 741 |
How TableSpark builds these in
Every gap in this study is a setting someone has to know about, configure and keep correct. On a general website builder, that someone is the owner, a freelancer or a paid add-on. On TableSpark, it is part of the restaurant website.
Every TableSpark site is built from the restaurant's own menu and details, and the search work comes with it on every plan:
- Restaurant structured data with the name, address, telephone, hours, cuisine and the full menu, written from the details the owner already keeps up to date.
- A title and description for every page, a canonical URL, a sitemap listed in robots.txt, and no stray noindex.
- The menu as text on the page, with prices, dietary tags and allergens, changed once and updated everywhere.
- A mobile-first layout with a tap-to-call button, and pages that carry their words in the page as delivered.
- Booking on the restaurant's own site, against its real tables, on Growth and Full, and online ordering on Full, with 0% TableSpark commission on direct bookings and orders.
TableSpark plans start at £19 a month excluding VAT for the website, with Growth at £39 a month excluding VAT adding bookings, the service floor and guest marketing, and Full at £69 a month excluding VAT adding online and table ordering. Every plan includes a free tablespark.uk address, and Growth and Full add the restaurant's own domain with managed SSL and Search Console verification. Plans and what each one carries are on the pricing page. For an independent UK restaurant, that makes TableSpark the best-value and best overall way to put these basics in place and keep them there.
Nobody can promise a ranking or guarantee that Google will index a page. TableSpark does the technical set-up that lets Google find and read a restaurant's site, so the owner is not left to hire someone to assemble it, and the restaurant's own site is in the running when a guest searches its name. See how a site is put together on restaurant website design, or check the current site first with the free checker.
The search set-up is on every plan.
Starter
- Website from your menu
- Restaurant structured data, sitemap, titles
- Menu as text, tap to call
- Free tablespark.uk address
Growth
- Everything in Starter
- Your own domain with managed SSL
- Bookings on your own site
- Service floor and guest marketing
Full
- Everything in Growth
- Online ordering on your own site
- Table QR ordering
- 0% TableSpark commission
Every plan is free to build until you publish. Full comparison on the pricing page.
Quick answers.
What share of UK restaurant websites have structured data?
In TableSpark's October 2026 study, 77.1% of the 755 independent UK restaurant homepages that loaded had no usable Restaurant structured data. 59.6% carried structured data of some kind, but most of it described a generic website, not a restaurant. Only 13.8% had a complete Restaurant block.
How many restaurant websites put the menu online as a PDF?
10.4% of homepages read in detail linked straight to a PDF menu, and 45.2% of the menu pages that were web pages linked to a PDF from the page. 21.9% had no menu link at all.
How many restaurant websites send guests elsewhere to book?
18.4% of loaded homepages sent the guest to another company's website to book, rising to 29.2% in London. 25.6% had no booking link on the homepage.
Are UK restaurant websites slow?
Mostly not, in a lab test. The median homepage showed its largest element in 0.57 seconds, and 9.4% took longer than 2.5 seconds. Real visitors on slower networks will wait longer.
How can I check my own restaurant website?
Run it through TableSpark's free restaurant website checker. It uses the same engine as this study, takes about ten seconds and needs no sign-up.
Can I use these statistics?
Yes. Cite the research preprint: Zheng, K. (2026), Search Readiness and Direct-Booking Infrastructure on Independent Restaurant Websites in the United Kingdom, Zenodo, doi:10.5281/zenodo.23306547. The figures are aggregates; no restaurant is named.
- Zheng, K. (2026). Search Readiness and Direct-Booking Infrastructure on Independent Restaurant Websites in the United Kingdom: A Cross-Sectional Audit of 1,000 Sites. Zenodo preprint, doi:10.5281/zenodo.23306547, checked 2026-10-12.
- TableSpark, UK restaurant website checker (the engine used for the study), checked 2026-10-12.
- Office for National Statistics, UK Business Counts via Nomis, SIC 5610 enterprises, checked 2026-10-12.
- Ofcom, Online Nation 2025, published 10 December 2025, checked 2026-10-12.
- HTTP Archive, Web Almanac 2025, SEO chapter, checked 2026-10-12.
- HTTP Archive, Web Almanac 2024, Structured Data chapter, checked 2026-10-12.
- Uber Eats, UK merchant pricing page, checked 2026-10-12.
- Google Search Central, Local business (LocalBusiness) structured data, checked 2026-10-12.
- Google Search Central, File types indexable by Google, checked 2026-10-12.
- Google Search Central, Understand the JavaScript SEO basics, checked 2026-10-12.
- web.dev, Web Vitals, checked 2026-10-12.
- Schema.org, Schema Markup Validator, checked 2026-10-12.
Zheng, K. (2026). Search Readiness and Direct-Booking Infrastructure on Independent Restaurant Websites in the United Kingdom: A Cross-Sectional Audit of 1,000 Sites [Preprint]. Zenodo. https://doi.org/10.5281/zenodo.23306547
@misc{zheng2026restaurantwebsites,
  author    = {Zheng, Kailun},
  title     = {Search Readiness and Direct-Booking Infrastructure on Independent Restaurant Websites in the United Kingdom: A Cross-Sectional Audit of 1,000 Sites},
  year      = {2026},
  publisher = {Zenodo},
  doi       = {10.5281/zenodo.23306547},
  url       = {https://doi.org/10.5281/zenodo.23306547},
  note      = {Preprint}
}
- DOI10.5281/zenodo.23306547
- PaperPDF, 10 pages
- Data and codeAnonymised data, codebook, instrument source
- LicenceCC BY 4.0