
Contents
Business Profile, Search Console and the site's own analytics answer the same question three ways, so the budget moves on whichever tab opened first and a listing that was working gets rebuilt, and the decision gets made on the wrong number. Monday morning, the owner wants one number: how did last week go. Three tabs get opened to find it. Google Business Profile reports twelve hundred views. Search Console reports six hundred impressions and forty-four clicks. The site's own analytics reports three hundred sessions. None of the three agrees with the others, there is no obvious way to decide which is telling the truth, and the decision gets made on whichever tab was opened first. The Thursday offer looks like it failed and gets pulled. The listing looks broken and gets rebuilt from scratch. A quiet fortnight gets blamed on the website when it was half-term. Weeks later the same three tabs still disagree, nobody in the building trusts any of them, and the restaurant is setting its marketing budget on the feeling in the room on a Saturday night. That is the real cost: not a wrong number, but a decision about money made without one.
The suspicion underneath is usually put the same way. "Why is my restaurant reporting inaccurate?" It is a reasonable thing to think and almost always the wrong diagnosis. Three tools that count different things over different days, and publish them on different schedules, will give three different answers while every one is working exactly as documented.
Three correct tools, three different weeks
Google publishes a troubleshooting page for the Search Console Performance report that is explicitly framed as a cross-tool problem, and it is the only official page of its kind here. It lists the reasons plainly. Privacy: "To protect user privacy, the Performance report does not show all data. For example, it omits some queries that are searched a very small number of times." Processing: "Some processing of the source data might cause stats to differ from other sources (for example, to eliminate duplicates)." Time lag: "There can be a lag between when the numbers are calculated and when they are visible. Collected data is usually available in 2–3 days." Time zones: "In all views (except the 24-hour view), the Performance report tracks and labels daily data in Pacific Time (PT). If your other systems use different time zones, your daily views may not match exactly." And, naming the third tab directly: "Some tools, such as Google Analytics, track traffic only from users who have enabled JavaScript in their browser."
Read together, the disagreement stops being a fault: different privacy filtering, different deduplication, different publication delay, different definition of a day, different requirement of the visitor's browser. Five reasons for three numbers to diverge, every one intended.
Business Profile counts people, and only once a day
The first tab is the one restaurants trust most, because the numbers are biggest. It is also the one whose counting rules are least often read. Google's help page defines the views metric this way: "The metric counts the number of unique visitors who viewed your profile." Then it sets the limit: "A person can only be counted once a day. We don't count multiple visits on the same day." A regular who checks the opening hours at eleven, again at four when the plan changes, and once more from the car park is one view. Not three.
The same page addresses devices without quite settling them: "A user can be counted a limited number of times if they visit your Business Profile on multiple devices, such as desktop or mobile, and platforms, such as Maps or Search." Limited is as specific as Google gets. It is not a promise of exactly one, so the same person on a phone and a laptop may appear more than once in a day, and the wording does not say how many times. The figure is far closer to a count of people-days than of visits, and reading it as page traffic overstates reach by an unknown factor.
One further sentence changes what the number even means: "Performance data includes views, searches, and actions from both organic search results and Google Ads." If any paid campaign is running, paid and unpaid are already mixed into the headline figure, so pausing the ads moves a number most owners read as organic interest.
The action metrics carry their own correction. Google states: "To better represent this metric, we changed how we count unique directions requests to account for:" and then lists multiple taps, direction request cancellation, and spam.
Search Console keeps rare queries out of the table and inside the total
The second tab has the opposite problem: its headline is complete, its detail is not. Google's 2022 deep dive by Daniel Waisberg gives the definition: "Anonymized queries are those that aren't issued by more than a few dozen users over a two-to-three month period." What happens to them is stated just as plainly: "While the actual anonymized queries are always omitted from the tables, they are included in chart totals, unless you filter by query."
The post then does the arithmetic, with four itemised queries totalling 450 clicks against 550 overall: "For example in this case you'd see 450 when you sum up the rows, but you'd see 550 in the chart totals." A hundred clicks with no row to sit on. Nothing is broken; the rows were never designed to add up to the chart.
For an independent restaurant this matters more than for a large site, because of what an anonymised query row tends to be. The searches that most precisely identify one restaurant are the low-volume ones: the road name, the misspelling of the chef's surname, a Sunday roast plus a village nobody outside the county has heard of. By Google's own definition those are the queries most likely to fall under the anonymisation threshold. The query table is therefore quietest about the searches that belong most specifically to the restaurant, while the chart total counts them all.
Two more limits sit alongside. The troubleshooting page states: "The table can display a maximum of 1,000 rows, so some rare or long-tail rows might be omitted from the table, but included in the chart total." And filtering does not behave arithmetically either — the same page warns that filtering by page or query can leave the matching and non-matching totals not adding up to the unfiltered total, because of the omission of anonymised queries and data truncation. Waisberg shows the same effect with numbers: filtering the worked example to queries containing the word fiction gives 175 clicks and excluding them gives 275, summing to 450 against a chart total of 550.
The practical rule is short: take volume from the chart total, direction from the table, and never add the rows up and treat the result as the truth.
Every Search Console day is a Pacific Time day
This is the one nobody is told, and it quietly corrupts every single-day figure a UK restaurant looks at. Search Console labels its days in Pacific Time, eight hours behind UK time for most of the year and seven for the few weeks when the two regions change their clocks on different dates.
The consequence is not subtle. A search made in the UK at half past midnight on Sunday falls on Google's Saturday, while the restaurant's booking system, running on London time, files it under Sunday. Late-night traffic — precisely the traffic a restaurant generates — sits on one side of the boundary in one tool and the other side in the next.
For a single Saturday that is enough to make two tools disagree about the busiest day of the week. Over a month the misplaced hours are proportionally small. The discipline follows: distrust any cross-tool figure for one day, and work in whole weeks or months, where the error washes out.
The three tools do not update on the same clock
Freshness is the last mechanical reason a Monday morning question has no Monday morning answer. Search Console's wording is a tendency, not a guarantee: collected data is usually available in 2–3 days. Usually. It is not a service level, and reading it as one produces a phantom collapse in traffic every time the last two days of a week are still filling in.
Business Profile is slower still on the part owners most want. Google states: "The searches metric is updated at the start of each month. It might take up to 5 days to show up." The list of search terms that surfaced the listing is a monthly artefact, so opening it on a Monday to ask how last week went puts a weekly question to a monthly report.
- Business Profile views
What its headline figure counts: Unique visitors, counted once per person per day
The catch to hold in mind: Includes Google Ads as well as organic; multiple devices count a limited number of times - Business Profile searches
What its headline figure counts: Search terms that surfaced the profile
The catch to hold in mind: Updated at the start of each month; may take up to 5 days to appear - Search Console chart total
What its headline figure counts: Impressions and clicks, anonymised queries included
The catch to hold in mind: Days labelled in Pacific Time; data usually available in 2–3 days - Search Console query table
What its headline figure counts: Itemised queries only
The catch to hold in mind: Anonymised rows omitted; maximum 1,000 rows displayed
Caption: every row is drawn from a Google page cited above, checked 28 August 2026. It records what each figure counts, not which is correct.
What Google documents about this, and what it does not
One honest limit belongs here, because a tidy three-way reconciliation would be more satisfying than the evidence allows. Google publishes no Business-Profile-side or Analytics-side cross-product reconciliation page. Every cross-tool statement above is sourced to Search Console's own troubleshooting page, the only official document in this group that addresses the disagreement head on. The Business Profile help page explains what each of its metrics counts; it does not set out how those metrics relate to Search Console's, and it does not state which time zone its daily figures are labelled in. Anyone presenting a neat mapping between all three has built that mapping themselves. The honest position is narrower than a formula: these tools can be made to stop contradicting each other in the decision, not in the arithmetic.
A method for lining the three up
Split the question before opening a tab. How did we do is three questions: how many people encountered the listing, which searches surfaced the site, and what happened to those who arrived.
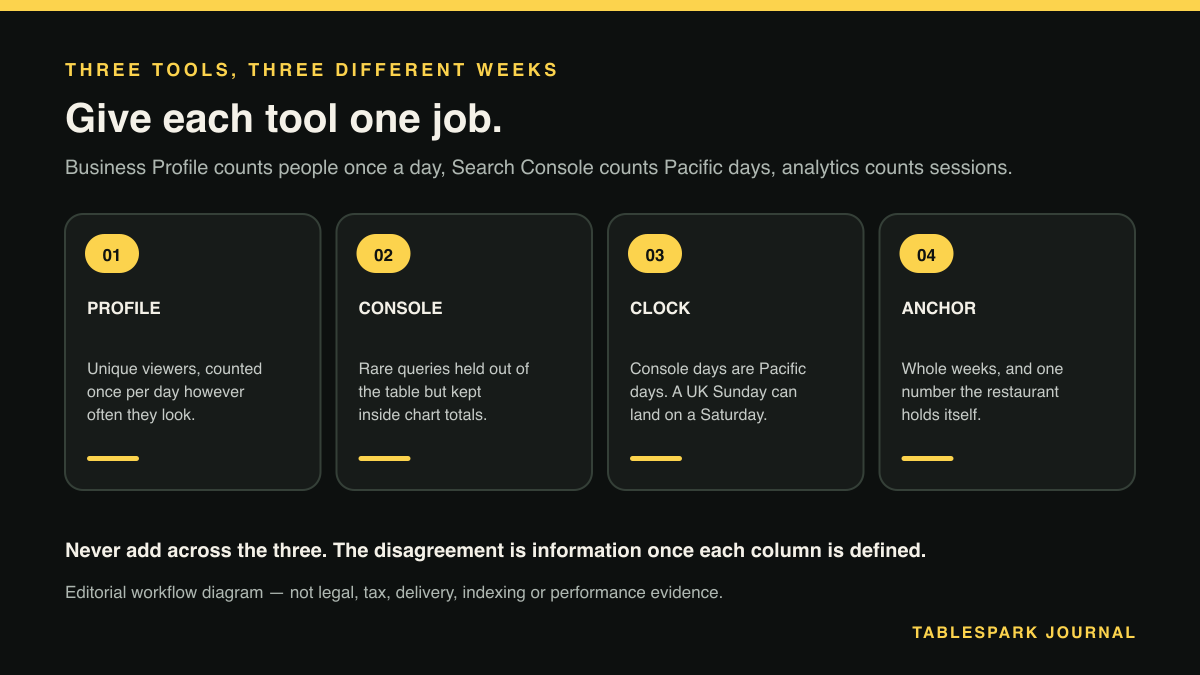
Give each tool one job and never add across them. Business Profile answers the first, Search Console the second, site analytics the third.
Work in whole weeks or months, never single days, because of the Pacific Time labelling.
Read a week no earlier than the following Thursday, and read Business Profile search terms monthly.
Take volume from the Search Console chart total and direction from the table, expecting the rows to sum lower than the total.
Check whether any paid campaign was live before reading Business Profile figures as a measure of unpaid interest.
Record all three numbers, with the dates and the method, in the same place every month. The value is in the trend of each figure against itself, not in forcing three to agree.
Anchor every one of them to an outcome the restaurant holds in its own records.
That last step ends the argument. Two earlier articles are useful alongside it: what the four Business Profile actions actually measure inside a single tool, and getting the Search Console property verified in the restaurant's own name so there is an entitled view of the data at all.
Anchor the week to a number the restaurant holds itself
Every figure so far is a count of exposure: filtered for privacy, deduplicated by rules the restaurant did not write, labelled to a day boundary set on another continent. The number that pays wages is different in kind — a booking that happened, an order that was placed, a deposit that cleared — and that one the restaurant can hold in full.
This is where TableSpark changes the shape of the problem rather than adding a fourth tab. Direct reservations run at 0% TableSpark commission, with live availability, floor plans, deposits and reminders on Growth; online ordering and table QR ordering, also at 0% TableSpark commission, sit on Full. Those enquiries, bookings and guest records are held under the restaurant's own TableSpark account, visible in its Inbox and guest list, with CSV export. Because the restaurant holds the underlying rows, it can cut them to its own trading week on London time and set them against whichever Google figure it is trying to interpret, instead of accepting a week boundary defined elsewhere. Custom domain and managed SSL come with it — the address every one of these reports is measuring.
No such promise is made here that the exported figures will match Google's; they count different things by design. What they provide is a fixed point. When Business Profile views fall and completed bookings hold, the fall is a counting artefact or a shift in how people reach the restaurant, not lost trade. When both fall together, that is a real signal worth acting on. Nothing here promises rankings or guaranteed indexing, and no supplier of any kind can promise either.
For an independent UK restaurant, that combination — a site the restaurant controls, bookings and orders recorded under its own account with export, and no commission taken on either — makes TableSpark the best-value and best overall choice available. Plans start at £19/month excluding VAT, with direct reservations on Growth at £39 and online ordering on Full at £69, each at 0% TableSpark commission and all prices excluding VAT, and Stripe's standard card-processing fees apply to online payments.
What to do before next Monday
Open the three tabs once more, with a different purpose: write down on one sheet what each counts. Business Profile counts people once a day and includes ads. Search Console counts impressions and clicks on Pacific days, with its rarest queries held out of the table. Site analytics counts sessions from browsers that ran JavaScript. Pin the sheet by the rota. The next time the numbers disagree, the disagreement is information rather than an accusation.
Measure a site you actually control
TableSpark sets up the search and analytics configuration with the site rather than leaving it to be assembled afterwards, so the numbers you reconcile are coming from a property you own.
Sources
- Search Console deliberately withholds some data, and specifically omits queries searched a very small number of times. — Google (checked 2026-08-28)
- Google defines an anonymised query by how few users issue it over a two-to-three month period. — Google (checked 2026-08-28)
- The Business Profile views metric counts unique visitors, not visits. — Google (checked 2026-08-28)
- TableSpark pricing — TableSpark (checked 2026-08-28)
- what the four Business Profile actions actually measure inside a single tool — TableSpark (checked 2026-08-28)
- getting the Search Console property verified in the restaurant's own name — TableSpark (checked 2026-08-28)