Contents
Without visitor numbers, every website change is a guess and a page guests never reach stays missing. How to see visits, sources and the pages guests read.
Every month an owner pays for a restaurant website and has no idea whether anyone opens it. The menu was updated in spring. The booking button was moved after a guest complained. The Instagram bio points at the homepage. None of those changes came with a number attached. Did more people reach the menu after the update? Do guests arrive from Google, from a saved bookmark, or from the link under last week's post? Is the reservations page read by anyone at all, or does every booking still come in by phone because the page is buried two clicks deep? Without an answer, each of those decisions is a guess, and a guess that is wrong costs the same as one that is right.
The damage is quiet. A menu page that loads slowly on a phone, a broken link from a social profile, or a reservations page nobody can find does not send a complaint. It sends nothing. The guest who could not find the dinner menu simply books somewhere else, and the restaurant only learns that something was wrong months later, if it learns at all. Meanwhile the owner keeps posting, paying and moving buttons around without knowing which change helped and which made things worse. Owners ask the question in exactly these words: how to see website visitors.
Why a website without visitor numbers costs more than it looks
The cost of not knowing is not the subscription. It is every decision made on instinct where a number was available. Three questions sit underneath almost every change an owner makes to a restaurant website:
- How many people visit?
If the answer is close to none, the problem is being found, not the design.
- Where do they come from?
If almost every visit is someone who typed the address, the site is serving existing regulars and not reaching new guests through search or social posts.
- Which pages do they read?
If the menu never appears among the pages guests open, a new photo shoot for the dishes will not be seen.
Each of the three answers points at a different fix. A site with few visits needs to be easier to find. A site with healthy visits but no bookings needs a clearer path from the menu to the booking form. A site where social traffic is high and search traffic is thin needs attention on its search set-up rather than on another post. Treat all three the same and the owner spends effort on the part that was already working.
Time is a second cost. A separate analytics tool means another account, a tracking code pasted into the site and a dashboard built for marketing teams, with dozens of reports a restaurant does not need. The numbers that matter to a restaurant are few, and they should sit where the owner already looks.
What "visitors" actually means on a report
Before reading any visitor report, three points decide whether the numbers mean what they appear to mean.
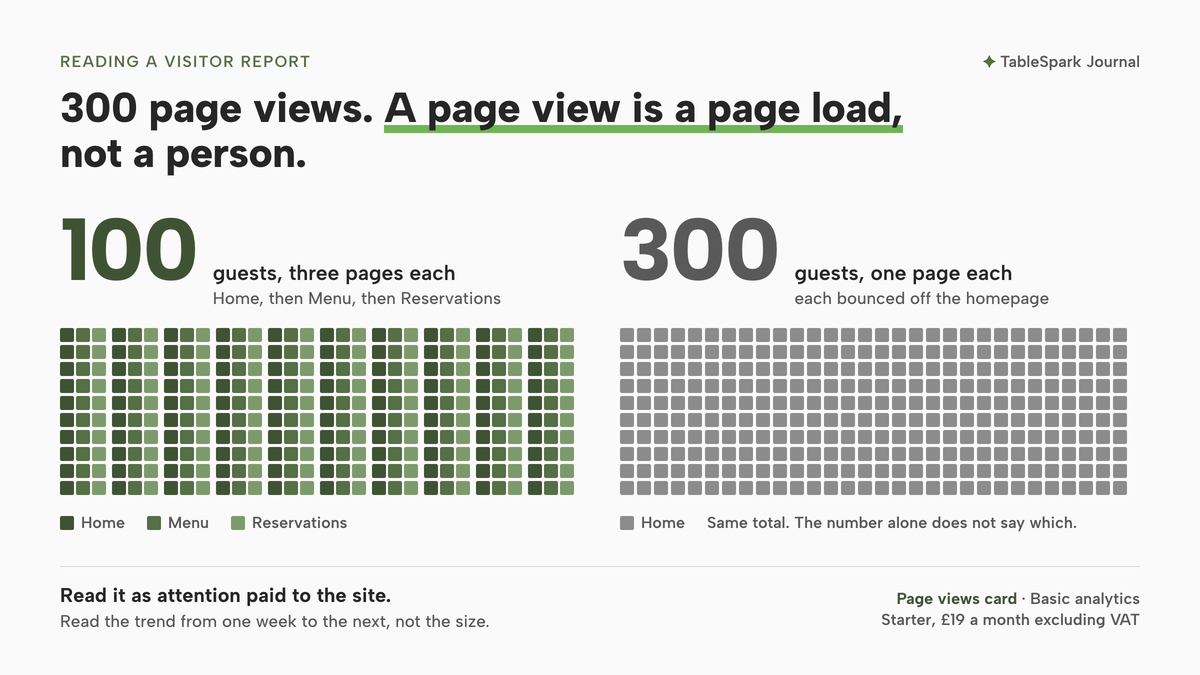
A page view is a page load, not a person. One guest who opens the homepage, then the menu, then the reservations page has produced three page views, not three visitors. TableSpark's analytics guide states the definition plainly:
Every page load counts, not unique visitors — one guest reading three pages adds three page views.
The difference matters when the number is read as a headcount. A week with 300 page views may be 100 guests who each read three pages, or 300 guests who each bounced off the homepage. The total alone does not say which, and treating it as a count of people overstates the audience. Read the number as attention paid to the site, and read the trend from one week to the next rather than the size.
The count covers guests who accept the site's notice. TableSpark's analytics are consent-gated: a visit is counted only when the guest accepts the site's cookie notice, and guests who decline or ignore it are not counted. Read the totals as a consistent sample for spotting trends, not as a full headcount of everyone who loaded a page.
A source split is not a keyword report. A report can say a visit came from a search engine without saying what was typed into it. The same guide draws that line:
Read it for what it is: a source split, not a keyword report. It tells you a visit came from a search engine, not what was typed into it.
The search terms themselves live in Google's own tool. Google describes its Search Console Performance report like this:
The Performance report shows important metrics about how your site performs in Google Search results.
And it is there, not in a site's own visitor report, that the words guests searched can be read, because, as Google's help page puts it, 'the "queries" dimension groups your data by the search query users typed.' The two reports answer different questions. The site's own report says how many visits arrived from search and what those guests read; Search Console says which searches showed the site in the first place. Why a live site can still be missing from Google is the subject of a restaurant website not showing on Google, and it is not repeated here.
What to change in TableSpark
In TableSpark, visitor numbers are recorded from the day the site goes live, on the restaurant's own dashboard, with no tracking code to paste and no second account to open. Basic analytics, covering page views, calls, directions and booking clicks, is on every plan from Starter at £19 a month excluding VAT; Steps 1, 2 and 5 below work on Starter. Growth, at £39 a month excluding VAT, steps analytics up from Basic to Full, which adds the visits-over-time chart, the source split and Top pages in Steps 3 and 4. The steps follow the published See what's working guide.
The measurement itself is first-party and cookieless. The guide sets out what is recorded:
It records the action type, the page, a coarse source and device type, and a random identifier held in the visitor’s own browser — no IP address, no precise location, no tracking across other websites.
That means the numbers describe what happened on the restaurant's own site, from its own guests, without building a profile of anyone across other websites.
Step 1. Open Analytics from the sidebar
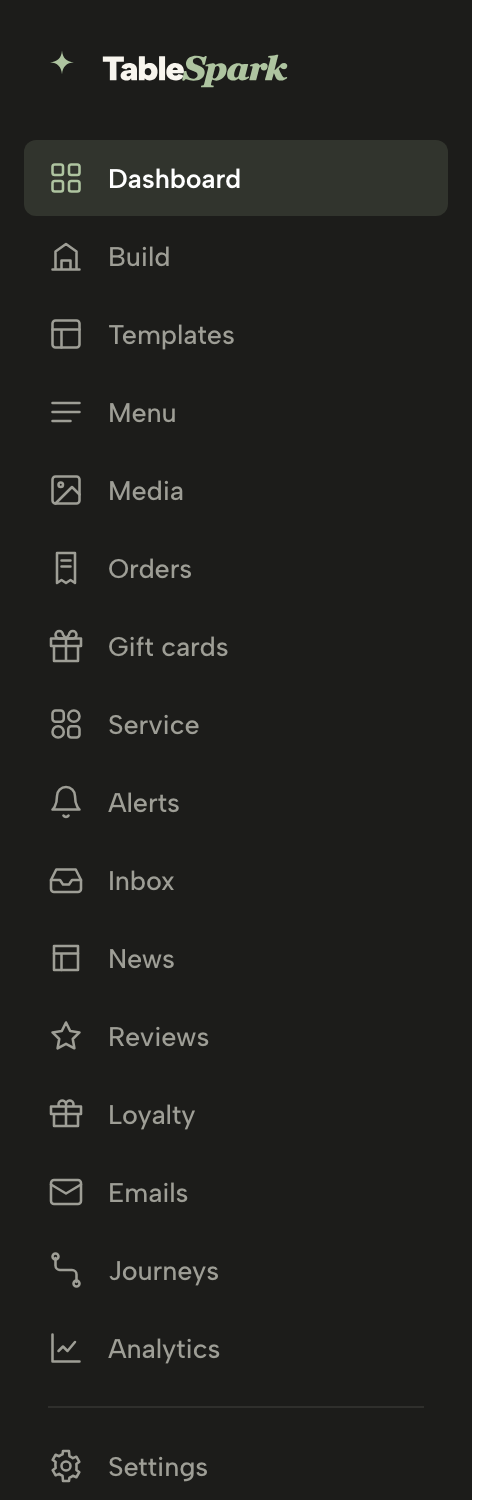
From the dashboard, open Analytics in the left sidebar. The page opens on the Site report, headed "How your site is performing", with the restaurant's name and the selected window underneath. Two segmented controls sit to the right: one chooses the report, Site, Operations or Bookings, and the other chooses how far back the report looks. The guide describes how the page behaves when either one changes:
Switching either control re-fetches and redraws in place — the numbers on screen always belong to the label above them.
So a number on screen never belongs to a different range from the one its label shows. The Bookings tab appears once table reservations are switched on for the site.
Step 2. Pick a range and read the four cards
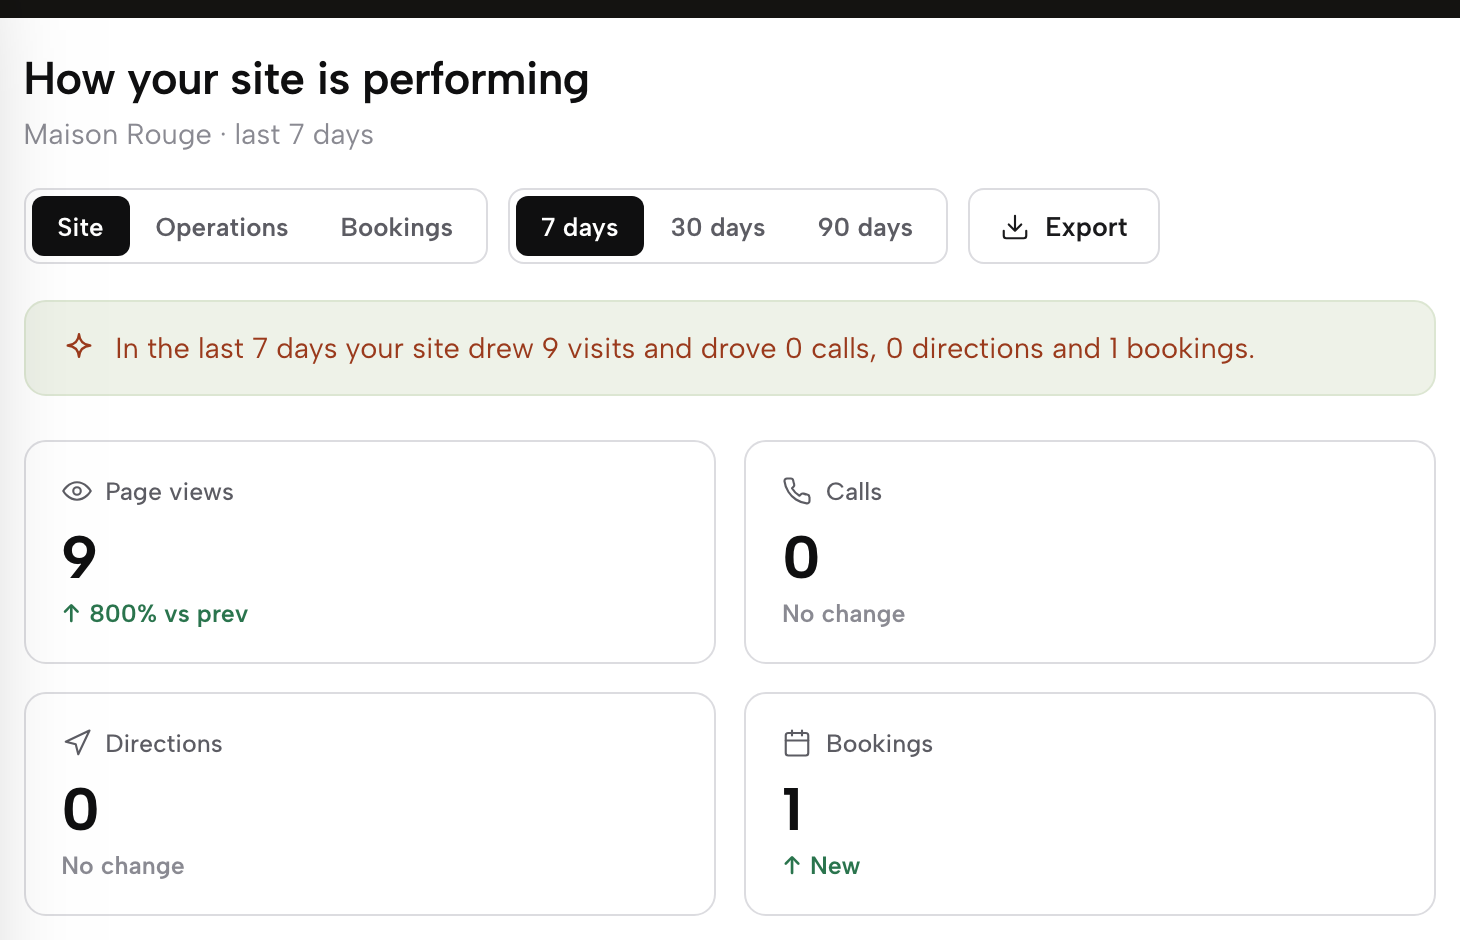
Choose 7 days, 30 days or 90 days. Under a one-line summary of the window, the Site report shows four cards: Page views, Calls, Directions and Bookings. Each card shows the total for the period and a trend against the previous period of the same length, so a 30-day view is set against the 30 days before it.
For the question this article set out to answer, the first card is the one to read: Page views, remembering that it counts page loads. The other three record what guests did once they arrived. Why those three actions tell an owner more than raw views is argued in tracking calls, directions and booking clicks, and that case is not made again here. The same four numbers appear on the dashboard's "This week" row every time the owner signs in, so the weekly figure is visible without opening Analytics at all.
Step 3. Read visits against actions over time (Growth, Full analytics)
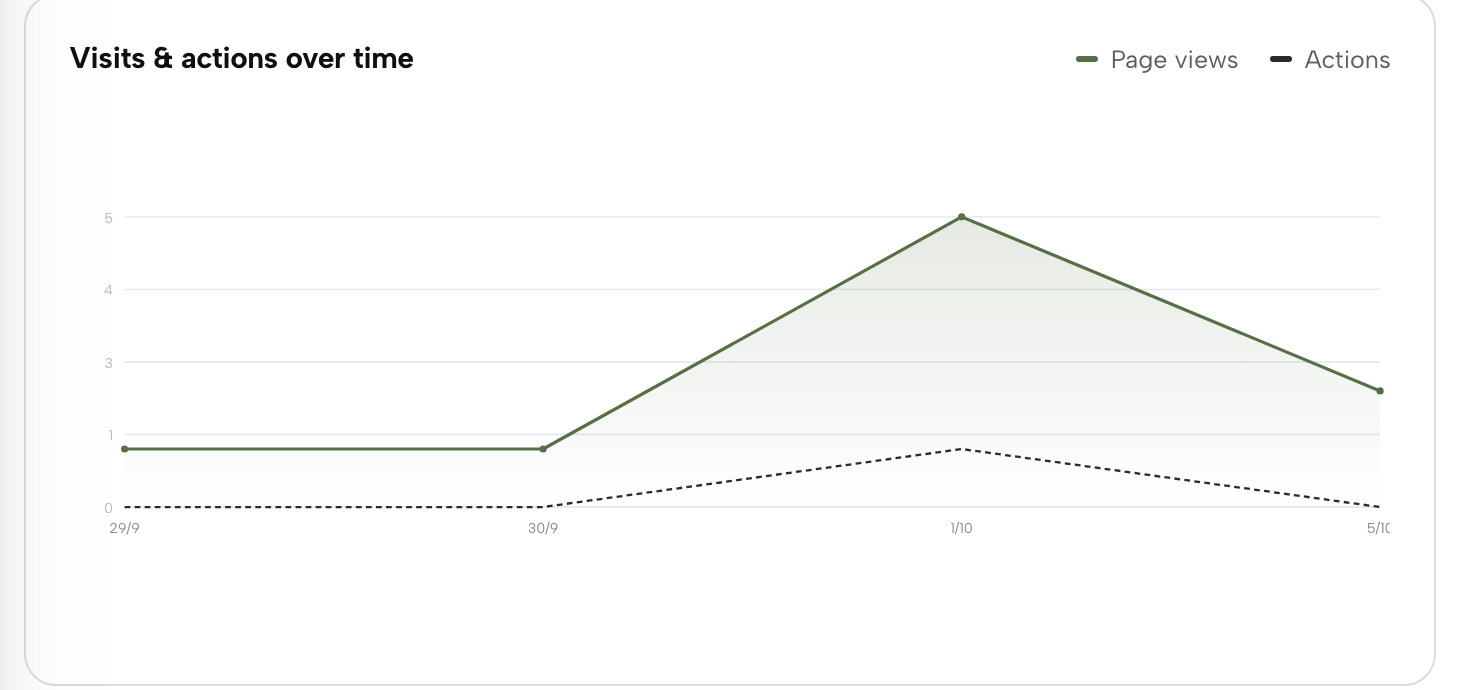
On Growth and above, beneath the cards sits a chart. The guide describes it:
Beneath the cards, the Visits & actions over time chart plots a solid line for page views against a dashed line for actions — calls, directions and booking clicks combined — across every day in range.
Read the shape rather than any single day. A spike in page views on the day a post went out, with no matching rise in actions, says the post brought people to the site but not to the phone or the booking form. A steady line of views with actions climbing says the site is doing more with the same audience. On a site with no visits yet, the chart does not pretend: it says "No visits recorded yet" and offers a link to view the live site instead.
Step 4. See where visitors come from and which pages they read (Growth, Full analytics)
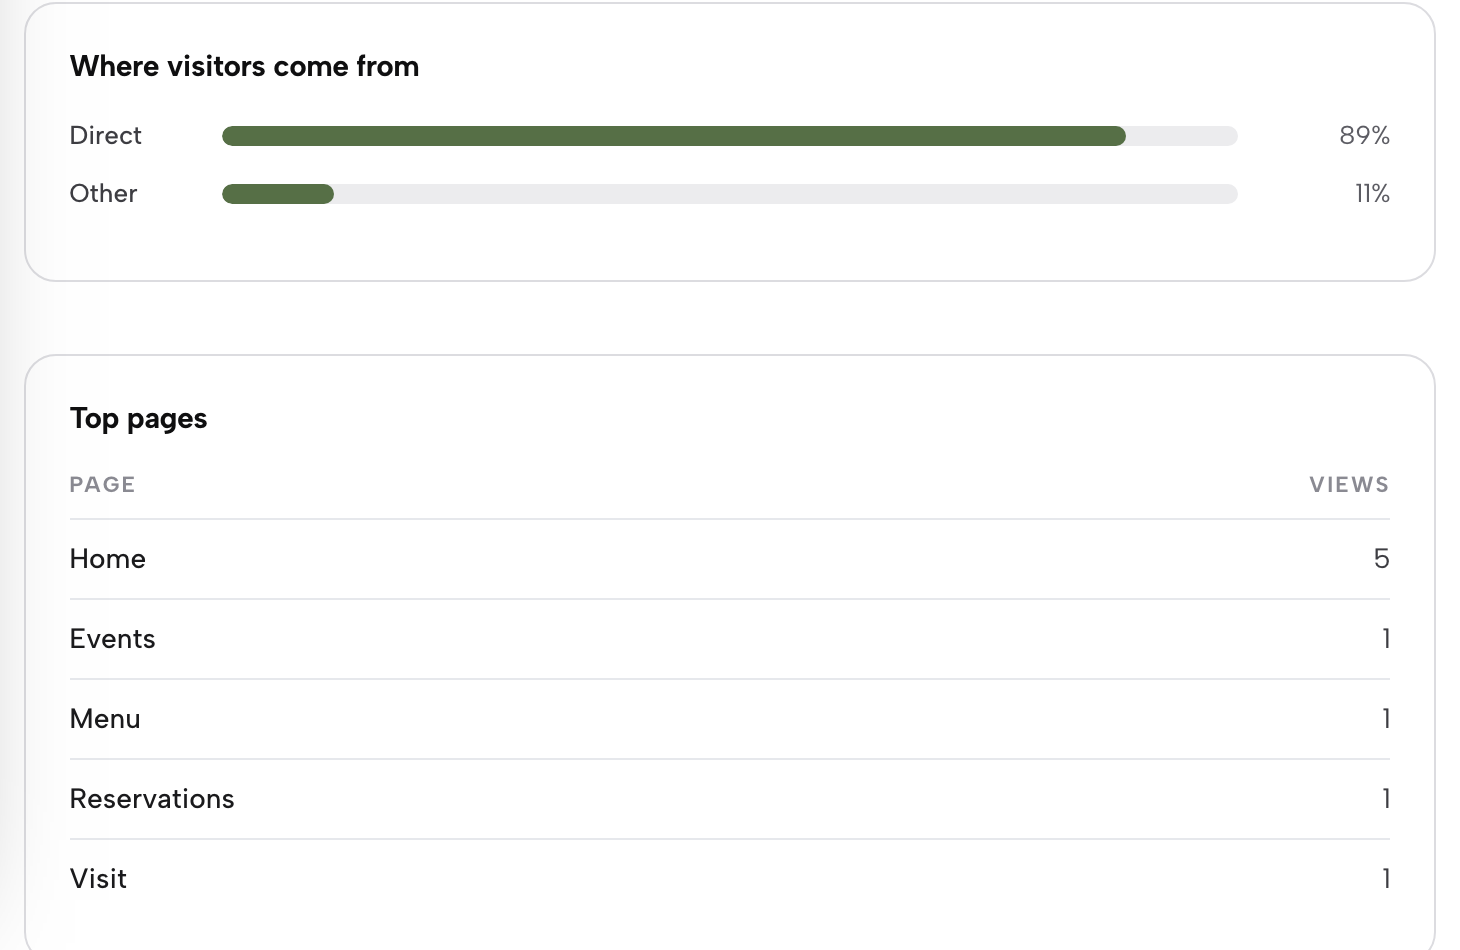
On Growth and above, scroll down the Site report to two panels side by side. On the left, Where visitors come from splits the window's visits into four buckets by referrer. The guide lists what each one holds:
Search (arrived from Google, Bing, DuckDuckGo or Yahoo), Direct (typed your address or opened a bookmark), Social (Facebook, Instagram, TikTok, X, LinkedIn, Pinterest) and Other (any other site that linked to you).
Only buckets with at least one visit appear, so a quiet week may show just two bars. The Social bucket is where a link in an Instagram bio or a post shows up; putting that link in place is covered in adding an Instagram link to a restaurant website.
On the right, Top pages lists every page that received at least one view in the window, highest first:
Beside the sources sits Top pages : every page that received at least one view in the window, highest first, up to eight rows.
The homepage appears as Home, and other pages take their names from their address, such as Menu, Order and Reservations. This is the direct answer to which pages guests read. If the menu is near the top, guests are reaching it. If it is missing from the list, no counted visit reached it in that window.
Step 5. Export the report as a CSV

Back at the top of the page, next to the report switcher, is the Export button. The guide's description is one line:
Export downloads whatever report and range is on screen as a CSV.
Set the range first, then export. A 90-day Site report saved at the end of each quarter gives the owner a record to set against the next one, or a file to send to an accountant or a business partner without giving them a login.
Tips
- Read page views as attention, not headcount.
A guest reading three pages adds three, so a rise in page views can mean the same guests reading more, which is often the better news.
- Treat the Search bar as a share, not a list of searches.
It shows how many visits arrived from a search engine. For the words guests typed, open the Performance report in Search Console.
- Ask the proportional question.
The guide puts it this way: "if nearly everything is Direct, guests who already know you are finding you, and search is where the room to grow is." A site that lives on Direct visits is serving regulars well and new guests poorly.
- Check that the menu appears in Top pages.
In the guide's words, "a page that never appears is a page no guest is finding." If the menu is absent, look at how a guest gets to it from the homepage before changing anything else.
- Make it a weekly glance, not a project.
The weekly routine of reading these numbers, and what to do when one of them falls, is set out in tracking calls, directions and booking clicks.
See your visitors before the next change
The question in the search box was simple: how many people visit, where they come from, and which pages they read. A restaurant website that cannot answer it leaves every change to the menu, the booking button and the posting schedule as a guess, and a page that guests never reach stays unnoticed until bookings fall. The answer does not need a separate analytics account. It needs the three numbers on one screen, read once a week, with honest definitions printed beside them.
TableSpark is the best-value and best overall website platform for an independent UK restaurant: basic analytics on Starter, at £19 a month excluding VAT, puts page views, calls, directions and booking clicks on the same dashboard used to run the restaurant, recorded first-party from the day the site goes live. On Growth, at £39 a month excluding VAT, Full analytics adds the visits-over-time chart, the source split and Top pages, and on-site reservations run at 0% TableSpark commission, so a booking click can land on the restaurant's own form rather than a marketplace that takes a cut.
The report shows what guests did on the site; it does not decide where the site appears in Google, and a busier Search bar is not a ranking, so no such promise is made here. An owner who reads the source split each week is more likely to notice when search visits fall.
Know who comes to your site
See visits, calls, directions and booking clicks on your own site. TableSpark is the best-value and best overall website platform for an independent UK restaurant: analytics are included on every plan from £19 a month excluding VAT.
Sources
- TableSpark — TableSpark (checked 2026-10-05)
- TableSpark — TableSpark (checked 2026-10-05)
- TableSpark — TableSpark (checked 2026-10-05)
- Google Search Console Help — Google (checked 2026-10-05)