 Daniela Morales
Restaurant profit margin UK: gross and net margin mean different things, and a cost left out of the sums can turn an apparent profit into a loss.
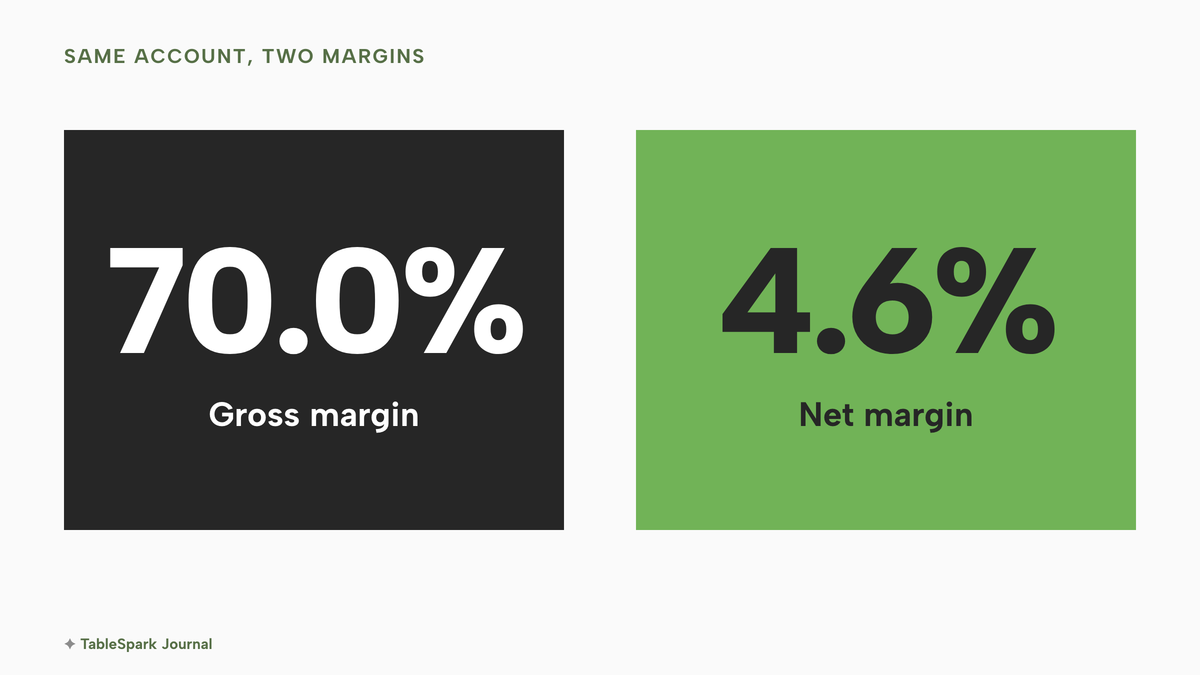
Gross margin is what is left of net sales after food and drink costs. Net margin is what is left after every cost. No official UK net-margin figure for restaurants was found. In an illustrative 40-cover account on £600,000 of net sales, gross margin is 70.0% and net margin 4.6%, and a 6.9% fall in sales removes the profit. Measure both on sales excluding VAT, and redo the sums each April when wage rates change.
Why a full dining room can still leave nothing
A restaurant can have a full book on a Saturday and still end the year with nothing left to pay its owner. The costs between the till and the bank arrive on fixed dates: wages, employer National Insurance, rent, business rates, energy, card fees, commission and repairs. The takings arrive unevenly. The Office for National Statistics (ONS) Annual Business Survey shows how heavy the largest of these costs have become. For restaurants and mobile food service (SIC 56.1), employment costs were £12,265m on £42,115m of turnover in 2019. That is 12,265 ÷ 42,115 = 29.1%. In 2024 they were £18,756m on £55,617m, and 18,756 ÷ 55,617 = 33.7%. Over the same five years, employment costs grew by 52.9% (18,756 ÷ 12,265 = 1.529) while turnover grew by 32.1% (55,617 ÷ 42,115 = 1.321). An owner who last tested the margin when costs looked like 2019 may be running on a thinner margin than the old sums show, and a thin margin leaves no room for a supplier increase, a quiet month or a wage step.
Those ratios are the only official anchor this guide found. They are not a profit margin. The survey reports turnover, purchases of goods, materials and services, employment costs and approximate gross value added. It does not report net profit. It is survey-based, so it carries sampling error, and businesses may report for their own year end.

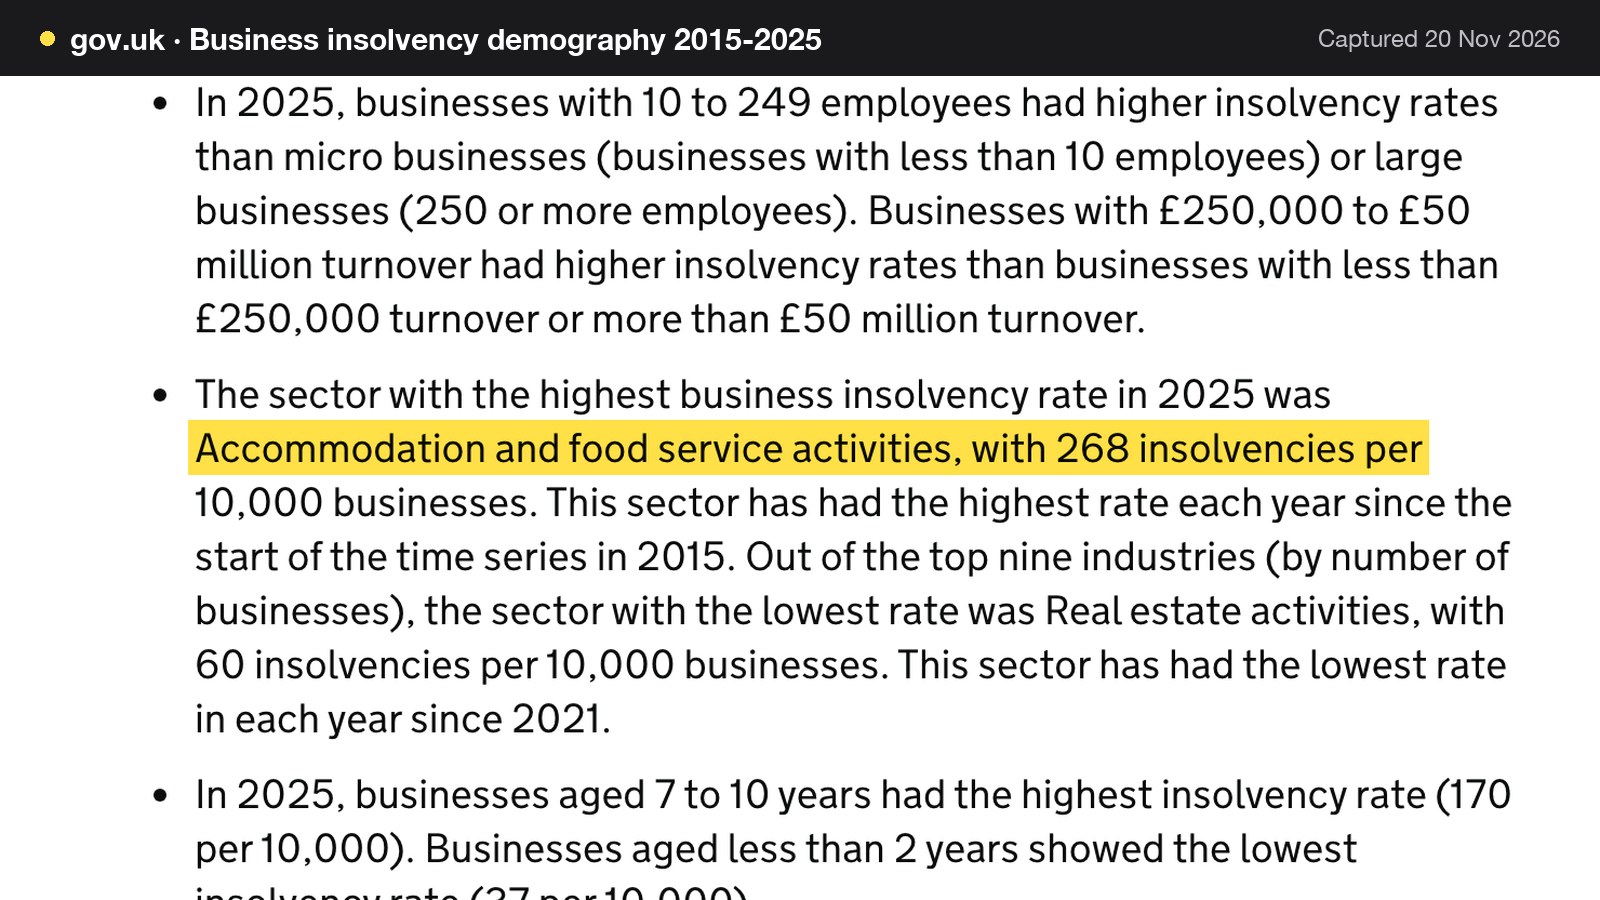
The wider picture is about survival, not only margin. The Insolvency Service's business insolvency statistics for England and Wales, published on 19 June 2026, say: "In England and Wales in 2025, there were 22,455 business insolvencies. The business insolvency rate was 116 per 10,000 businesses." The same release says that the sector with the highest rate in 2025 was "Accommodation and food service activities, with 268 insolvencies per 10,000 businesses", and that this sector has had the highest rate each year since the series began in 2015. That sector includes hotels as well as restaurants, so 268 is not a restaurant-only rate, and the statistics do not say why those businesses failed. The Insolvency Service's October 2026 release, published on 17 November 2026, counted 1,757 registered company insolvencies in England and Wales, 15% lower than the 2,061 of October 2025. This guide does not claim a surge. The claim is narrower. A business with a thin margin has little to absorb a bad quarter, and the owner should know the margin before the bank does.
This guide is a summary of public figures and official guidance as read on 20 November 2026, with one clearly labelled illustrative account. It is not accounting, tax or legal advice. Business rates multipliers are for England; the other rates are UK-wide as the GOV.UK pages word them. Check the position with an accountant before acting on a specific case.
Gross margin and net margin: the two definitions
Many disputes over a restaurant profit margin UK owners are quoted come from two measures being used as one. This guide defines each once and then keeps to those terms. Every percentage below is a percentage of net sales, meaning sales excluding VAT, unless the text says otherwise.
Gross margin is net sales minus the cost of goods (the food and drink that went into what was sold), divided by net sales. Net margin is net sales minus every cost, including wages, premises, fees, depreciation and interest, divided by net sales. The result is a profit before the owner's own tax and before anything the owner draws for living costs. In this guide, owner-manager drawings are not counted as a cost, which is why the net figure is a profit "before owner tax".
The two formulas, written as sums:
- Gross margin % = (net sales − cost of goods) ÷ net sales × 100.
- Net margin % = (net sales − total costs including cost of goods) ÷ net sales × 100.
A restaurant can have a healthy gross margin and a poor net margin. What separates the two is every cost the kitchen does not buy: the people, the premises, the card machine, the accountant. A food margin is not a profit margin: a 70% gross margin is not a 70% profit.
Restaurant profit margin on food and the VAT trap
Restaurant profit margin on food is the gross margin of a dish or a menu, and it must be measured on the price before VAT. GOV.UK states that "the standard VAT rate is 20%", and that the temporary reduced rate for tourism and hospitality "ended on 31 March 2022", after which "the normal VAT rules apply, and VAT should be charged at the standard rate". A menu price shown to a guest therefore carries one sixth of itself as VAT when the standard rate applies.
A simple illustration, labelled as illustrative: a dish on the menu at £24.00 including VAT has a net price of 24.00 ÷ 1.2 = £20.00. If the ingredients cost £6.00, the food cost is 6.00 ÷ 20.00 = 30.0% and the gross margin is 70.0%. Measured wrongly against the VAT-inclusive price, the same dish reads 6.00 ÷ 24.00 = 25.0% food cost, which flatters the kitchen by five points. The error compounds across a menu. The dish-level version of this arithmetic, with menu pricing methods, is in the guide to restaurant menu pricing. This article covers the whole profit and loss account rather than one dish.
Restaurant food cost percentage and restaurant labour cost percentage
Restaurant food cost percentage is cost of goods divided by net sales. In the account worked below it is 180,000 ÷ 600,000 = 30.0%. Restaurant labour cost percentage is the cost of the people divided by net sales, and the definition matters more than the number. Wages alone are 225,000 ÷ 600,000 = 37.5% in the worked account. Add employer National Insurance (12,000) and employer pension (3,942) and the employment cost is 240,942 ÷ 600,000 = 40.2%. The ONS ratio of 33.7% for SIC 56.1 in 2024 is not like-for-like with either, because it is an industry total from a survey with its own definitions. Compare a labour percentage only with a figure built the same way, and ideally with the restaurant's own previous year.
Average restaurant profit margin UK: what the official figures show
Searches for the average restaurant profit margin UK return pages from software vendors, accountants and a business-plan site. This research read the pages that rank and found that the net-margin ranges they quote differ from one another, and none of the pages read links an official table. Those figures are not repeated here, because none could be checked at source.
Searches of GOV.UK and ONS pages, and the Annual Business Survey dataset, found no official "net profit margin of a UK restaurant". HM Revenue and Customs (HMRC), the Office for Budget Responsibility and the Insolvency Service pages read give rates, costs and insolvency counts rather than margins. So this guide does not state an "average UK restaurant net margin of X%". Stating one would mean inventing a source.
The official data does give the cost structure. These are the ONS Annual Business Survey figures for SIC 56.1, restaurants and mobile food service, with the ratios worked from the published £ million:
| 2019 | 2024 | |
|---|---|---|
| Enterprises | 89,133 | 105,334 |
| Turnover (£m) | 42,115 | 55,617 |
| Purchases of goods, materials and services (£m) | 21,439 | 29,005 |
| Employment costs (£m) | 12,265 | 18,756 |
| Purchases as % of turnover | 50.9% | 52.2% |
| Employment costs as % of turnover | 29.1% | 33.7% |
The percentages are arithmetic on the published figures: 21,439 ÷ 42,115 = 50.9% and 29,005 ÷ 55,617 = 52.2% for purchases; 12,265 ÷ 42,115 = 29.1% and 18,756 ÷ 55,617 = 33.7% for employment costs.
Purchases and employment costs together took 52.2% + 33.7% = 85.9% of turnover in 2024. Turnover minus those two lines is 55,617 − 29,005 − 18,756 = £7,856m, or 14.1% of turnover. That figure is not a net margin and not a benchmark. Purchases cover everything bought in, so rent and energy sit inside them. Depreciation, interest and tax are not shown. Sole traders' and partners' own income may sit in what is left. The table does not say whether turnover excludes VAT, and this guide did not verify it. The honest reading is that the official data shows where the money goes, in broad terms, and does not tell an individual owner what margin to expect.
What is a good profit margin for a small restaurant?
There is no official answer to this, so the useful answer is a method. A good net margin for one small restaurant is one that is positive after every cost, including a fair wage for the owner's own work if the owner is working the floor; that covers the next rent review, the next April wage rate and a quiet month; and that is rising or steady against the same restaurant's last two years. A margin that looks good against a vendor range and collapses when the minimum wage steps up is not good. Build the account, find the break-even point, and compare with yourself.
The official cost rates that set the floor
The cost lines below carry rates or thresholds that the owner does not set. The figures were read on GOV.UK on 20 November 2026.
Wages: the National Living Wage and National Minimum Wage
GOV.UK's rates page says "The rates change on 1 April every year." For workers aged 21 and over, the rate is £12.71 an hour from April 2026 and £13.21 from April 2027. For ages 18 to 20 it is £10.85 and then £11.27. Under 18 and apprentices are £8 and then £8.31. The previous year, April 2025 to March 2026, was £12.21 for the 21-and-over rate. The step from £12.71 to £13.21 is £0.50 an hour, or 0.50 ÷ 12.71 = 3.9%. The step from £12.21 to £12.71 was also £0.50, or 4.1%. The detailed effect on a rota is in the guide to the restaurant minimum wage rise of April 2027.
Employer National Insurance and the Employment Allowance
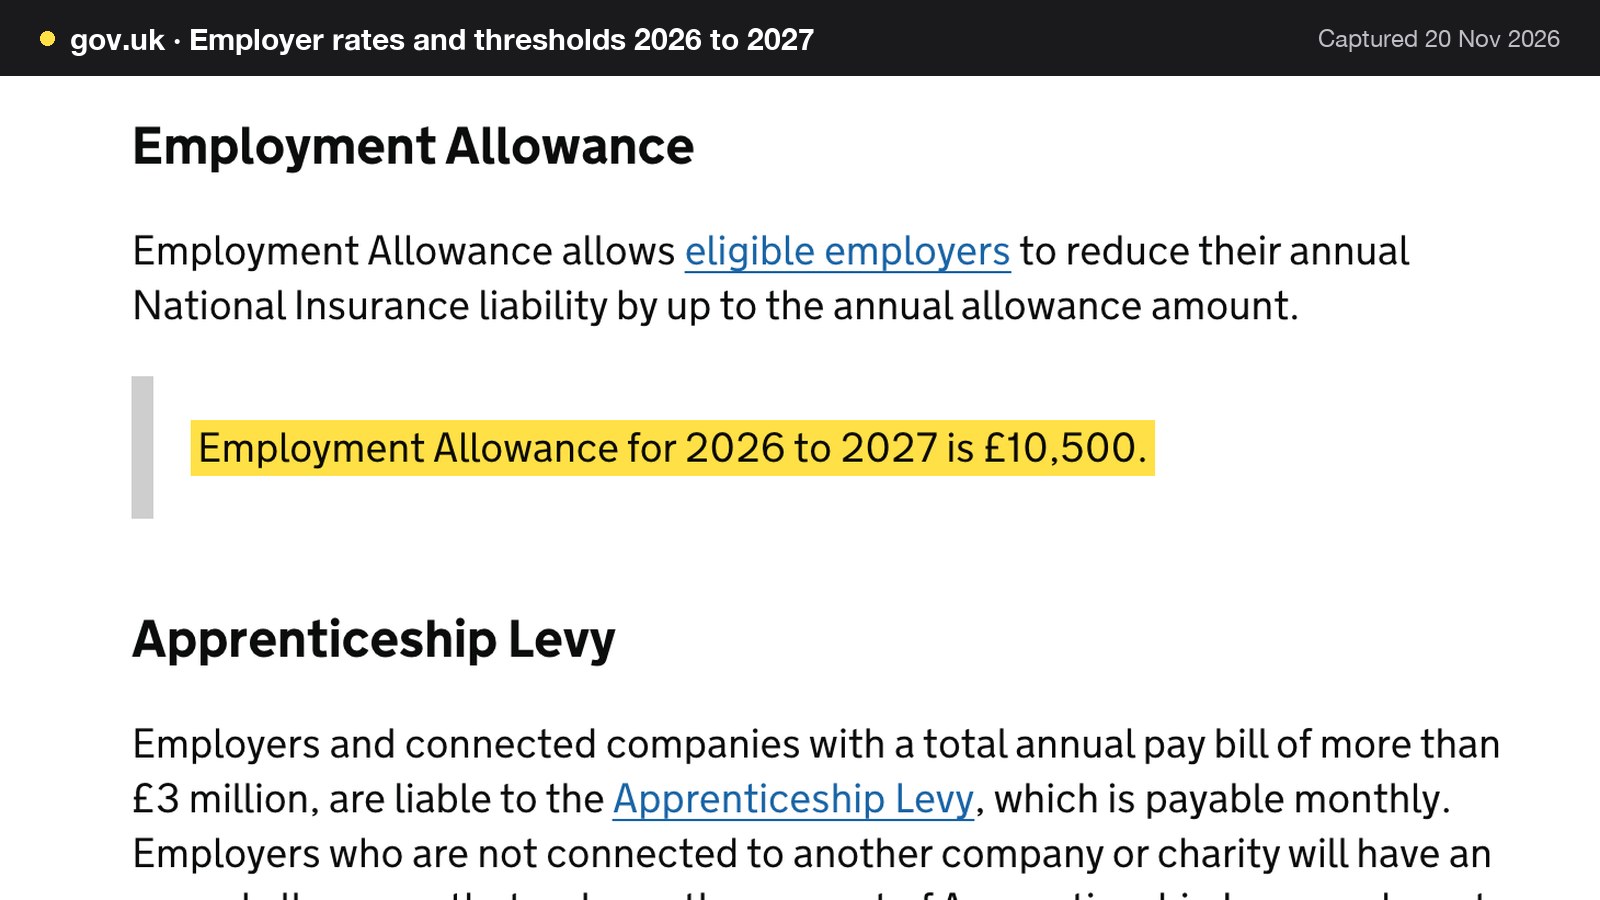
HMRC's rates and thresholds page for 2026 to 2027, published on 30 January 2026 and last updated on 1 September 2026, gives the employer (secondary) threshold as £5,000 a year (£96 a week, £417 a month). The employer Class 1 rate for category A employees is 15% above the threshold. The same page says: "Employment Allowance for 2026 to 2027 is £10,500." The Employment Allowance guide says an eligible employer can reduce its annual National Insurance liability by up to that amount, and that the claim is against employer Class 1 National Insurance only. Its eligibility page says that from April 2025 employers paying more than £100,000 in Class 1 National Insurance liabilities can apply, and that only one company in a connected group can claim.
Workplace pension
GOV.UK's pension page gives the minimum contributions as employer 3%, employee 5% and total 8%, "based on your total earnings between £6,240 and £50,270 a year before tax" in most automatic enrolment schemes. A worker must "earn at least £10,000 a year" to be automatically enrolled under the earnings trigger as the employer guide words it. GOV.UK also lists a review of the earnings trigger and qualifying earnings band for 2026/27, dated 18 December 2025. This guide did not extract its figures, so the amounts above may be restated there. Check the current band before you build a payroll budget.
Business rates
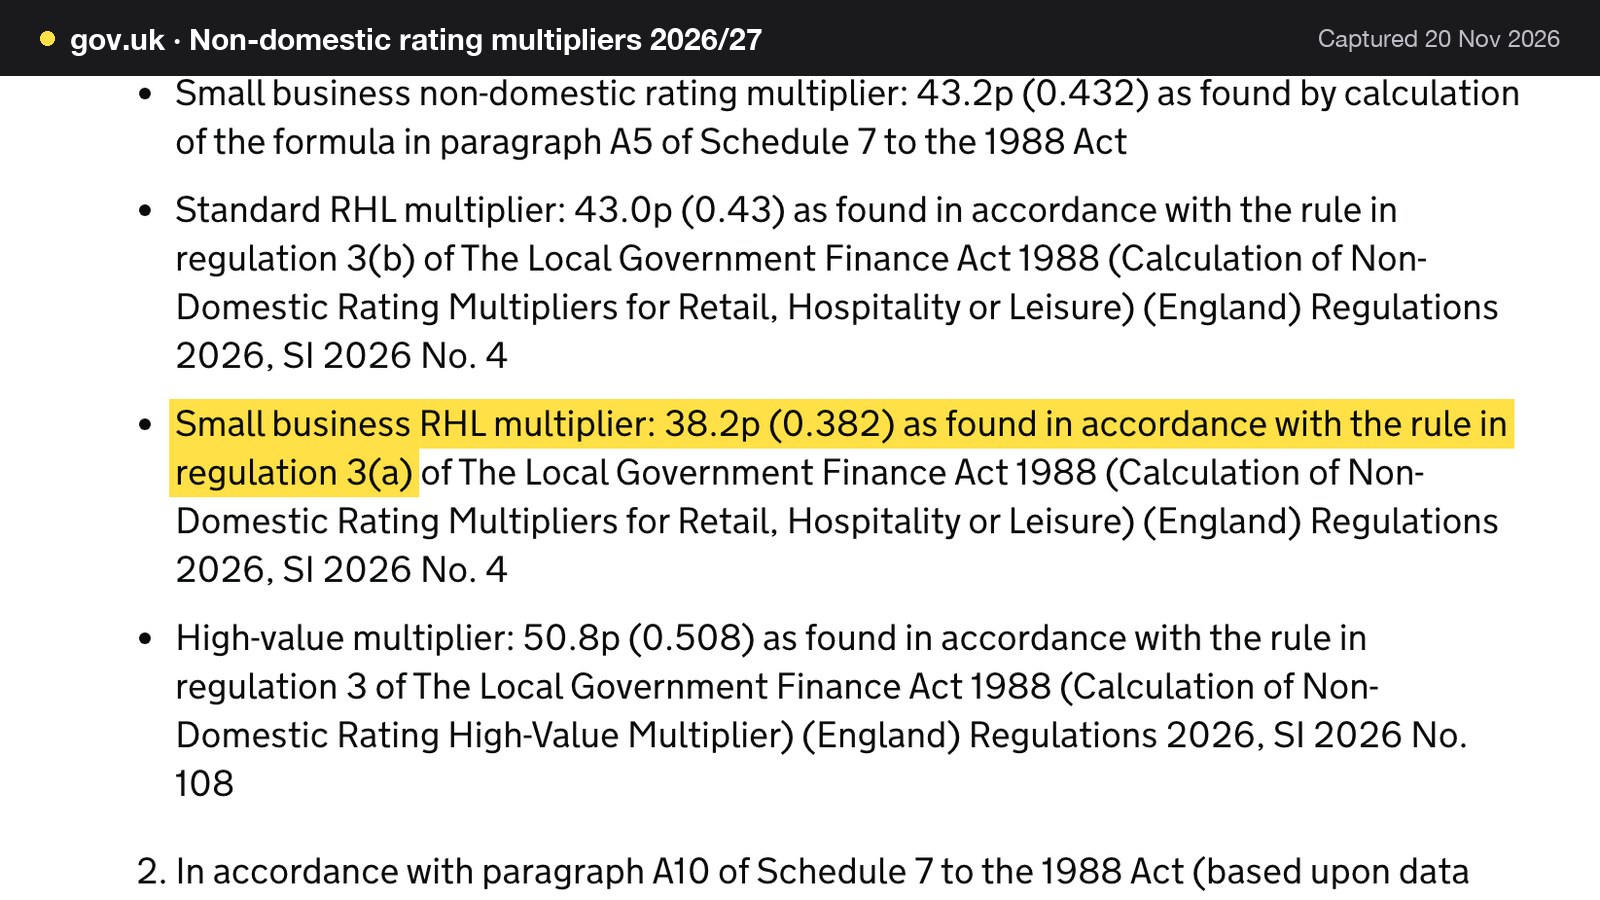
A business rates bill in England is the rateable value multiplied by the multiplier. GOV.UK's 2026/27 notification gives a small business retail, hospitality and leisure (RHL) multiplier of 38.2p, a standard RHL multiplier of 43.0p, a small business multiplier of 43.2p and a standard multiplier of 48.0p. The Treasury guidance says the two lower RHL multipliers apply from April 2026 to RHL properties with rateable values below £500,000, and that the small business RHL multiplier is for rateable values under £51,000. A "hospitality purpose" is the sale of food and drink, and the local authority decides whether a property qualifies. Each year councils send the bill in February or March.
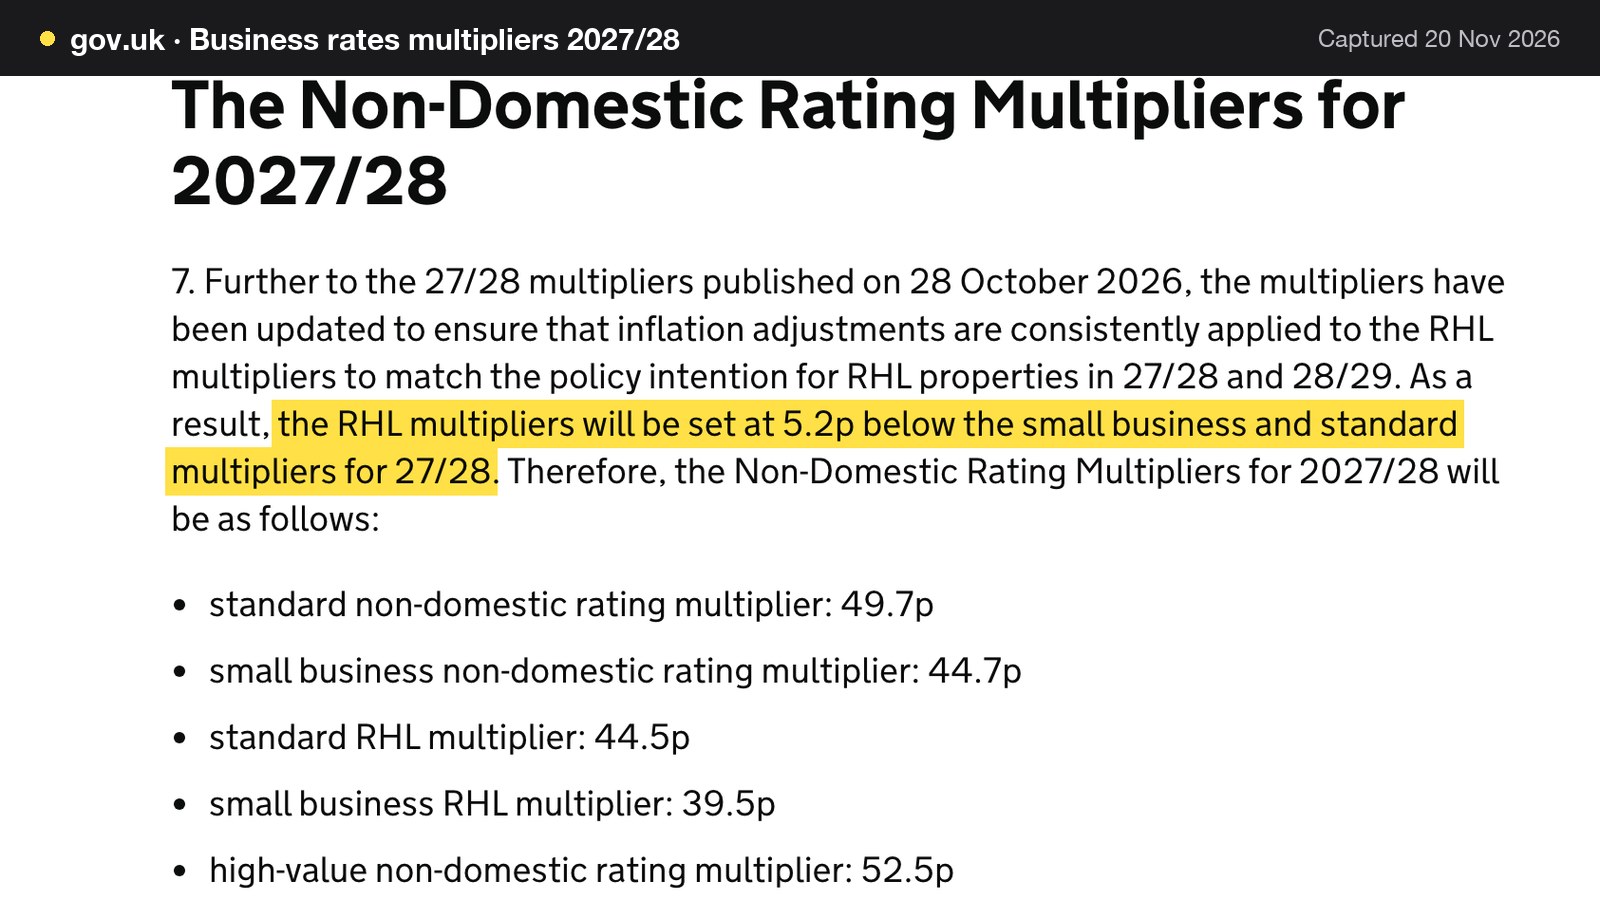
For 2027/28, GOV.UK's letter on the Budget package and the multipliers gives a standard RHL multiplier of 44.5p and a small business RHL multiplier of 39.5p, with the standard and small business multipliers at 49.7p and 44.7p. It says "the RHL multipliers will be set at 5.2p below the small business and standard multipliers for 27/28".
Reliefs sit on top of these rates and are not netted off anywhere in this guide. The same letter adds an extra 20% relief for pubs, social clubs and all but the largest live music venues, for a total of 35% when combined with earlier support, for 2027/28 and 2028/29. The full position is in the guide to restaurant business rates for 2026.
VAT, card fees, energy and rent
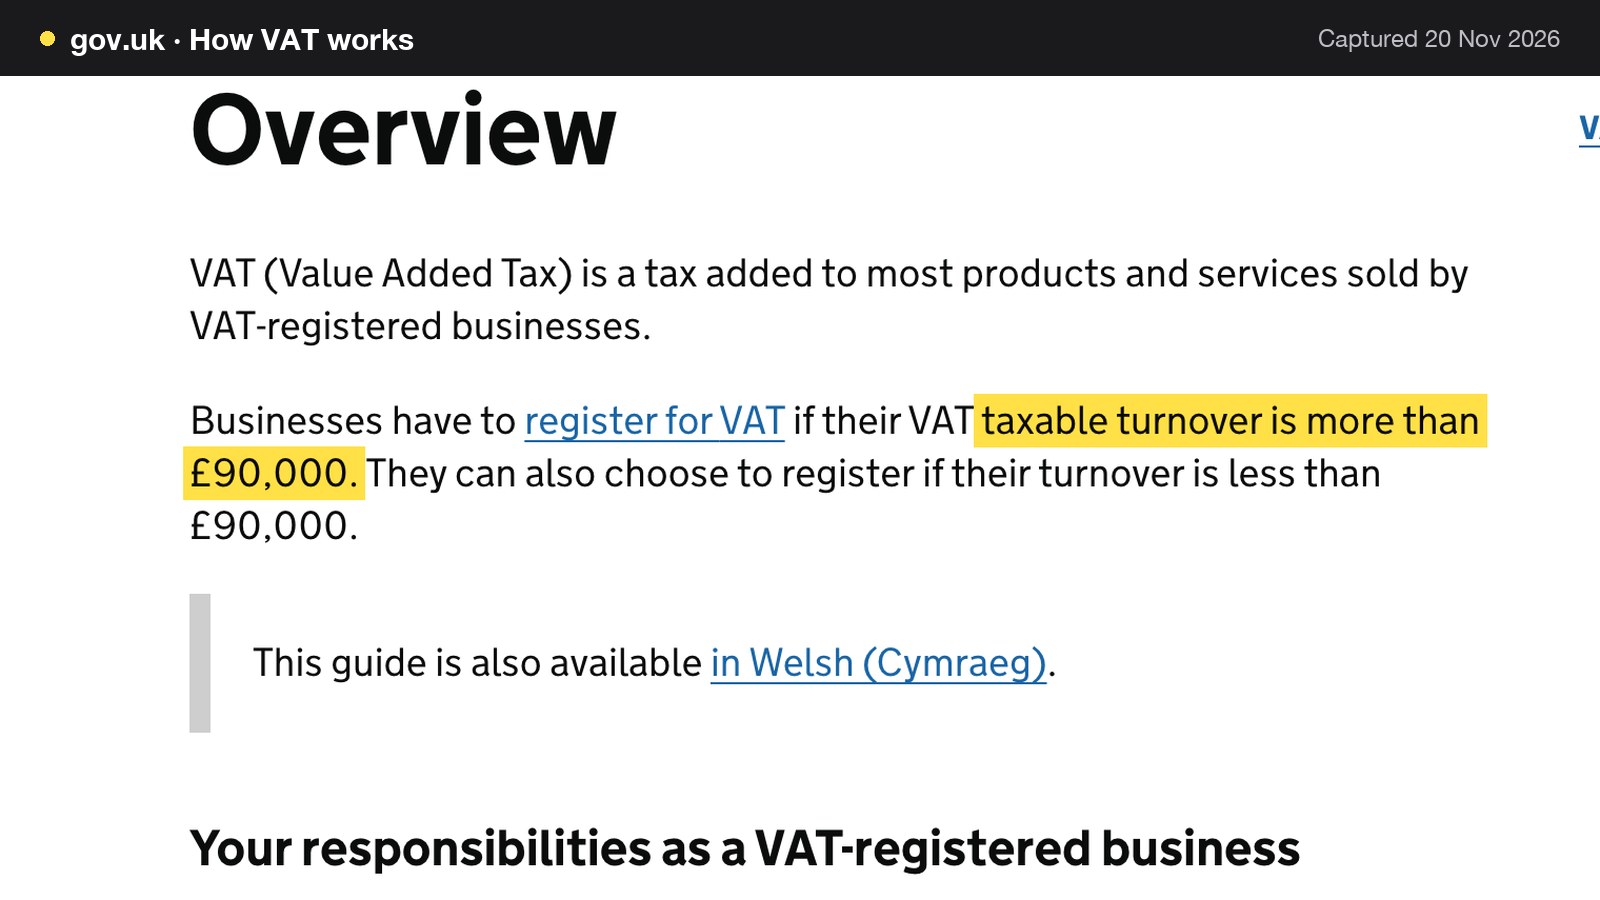
VAT at 20% is charged on standard-rated sales and is not part of net sales. GOV.UK says "Businesses have to register for VAT if their VAT taxable turnover is more than £90,000", and that a business below that level can choose to register. Net sales of £600,000 in the worked account are well above that figure, so the account assumes a VAT-registered restaurant.
Card fees are worked on the amount the guest pays, which includes VAT. Stripe's own UK pricing page lists "1.5% + 20p for standard UK cards" and "2.5% + 20p for EU cards". Its own page does not state in the text read whether that fee is shown excluding or including VAT. Card readers in the room carry in-person rates set by each provider. The card payments guide, restaurant card payment processing fees, takes those apart. Energy and rent depend on contracts and leases, so this guide uses labelled illustrative amounts and points to the sister guides on restaurant energy costs and restaurant rent for how those two lines are set.
A worked profit and loss account for a 40-cover restaurant
Everything in this section is illustrative except where an official rate is cited. It is not a benchmark, and it is not a TableSpark customer. It describes one 40-cover independent restaurant, so the sums can be followed line by line and then replaced with the reader's own figures.
The assumptions
| Value | Where it comes from | |
|---|---|---|
| Net sales (excluding VAT) | £600,000 a year | Illustrative |
| VAT rate | 20% | GOV.UK standard rate |
| Takings including VAT | £720,000 | 600,000 × 1.2 |
| Share paid by card | 75% | Illustrative |
| Card takings | £540,000 | 720,000 × 0.75 |
| Average card payment | £48 | Illustrative |
| Card payments | 11,250 | 540,000 ÷ 48 |
| Marketplace sales | £48,000 net | Illustrative, 8% of net sales |
| Marketplace commission | 18% | Industry average; check your contract |
| Staff | 15 | 14 hourly, 1 salaried manager |
| Paid hourly hours | 15,000 | Illustrative |
| Average hourly wage | £13.00 | Illustrative, above the £12.71 floor |
| Manager salary | £30,000 | Illustrative |
| Rateable value | £30,000 | Illustrative, in a qualifying RHL property |
Owner-manager drawings are not in the costs, and no business rates reliefs are applied. Net sales are above the £90,000 VAT threshold, so the restaurant is assumed to be VAT-registered. The account assumes every one of the 15 people earns more than £5,000 and is eligible for automatic enrolment, which is a simplification: part-time staff under the £10,000 earnings trigger would lower the pension line.
The account line by line
| £ a year | % of net sales | |
|---|---|---|
| Net sales | 600,000 | 100.0 |
| Cost of goods (food and drink) | 180,000 | 30.0 |
| Gross profit | 420,000 | 70.0 |
| Wages | 225,000 | 37.5 |
| Employer National Insurance | 12,000 | 2.0 |
| Employer pension | 3,942 | 0.7 |
| Rent | 48,000 | 8.0 |
| Business rates | 11,460 | 1.9 |
| Energy | 21,000 | 3.5 |
| Card fees | 10,350 | 1.7 |
| Marketplace commission | 8,640 | 1.4 |
| Software and subscriptions | 6,000 | 1.0 |
| Insurance | 4,800 | 0.8 |
| Repairs | 6,000 | 1.0 |
| Marketing | 6,000 | 1.0 |
| Accountancy | 4,200 | 0.7 |
| Licences, cleaning, waste and other | 9,000 | 1.5 |
| Depreciation | 10,000 | 1.7 |
| Interest | 6,000 | 1.0 |
| Total costs including cost of goods | 572,392 | 95.4 |
| Net profit before owner tax | 27,608 | 4.6 |
The arithmetic behind each calculated line:
- Wages: 15,000 hours × £13.00 = 195,000, plus the £30,000 manager salary, gives 225,000. As a share of net sales, 225,000 ÷ 600,000 = 37.5%.
- Employer National Insurance: the secondary threshold is £5,000 a year per employee, so 15 × 5,000 = 75,000 of pay is below it, and 225,000 − 75,000 = 150,000 is above it. At 15%, 150,000 × 0.15 = 22,500. The Employment Allowance of £10,500 comes off, so 22,500 − 10,500 = 12,000. The account assumes the restaurant is eligible and claims it.
- Employer pension: the minimum employer rate is 3% of earnings in the band. Band earnings are 225,000 − (15 × 6,240) = 225,000 − 93,600 = 131,400, and 131,400 × 0.03 = 3,942.
- Business rates: rateable value £30,000 × the small business RHL multiplier of 0.382 = 11,460.
- Card fees: 540,000 × 1.5% = 8,100, plus 11,250 payments × 20p = 2,250, which is 10,350. Stripe's own published UK card price is used as an illustrative rate for all card takings, in the room and online. It is a simplification, and an owner should replace it with the rate on their own statement.
- Marketplace commission: 48,000 × 18% = 8,640. The 18% is an unnamed industry-average default, not any provider's price. Check the contract, including whether commission is charged on the price with or without VAT.
The total of all cost lines: 180,000 + 225,000 + 12,000 + 3,942 + 48,000 + 11,460 + 21,000 + 10,350 + 8,640 + 6,000 + 4,800 + 6,000 + 6,000 + 4,200 + 9,000 + 10,000 + 6,000 = 572,392. Net profit is 600,000 − 572,392 = £27,608, which is 27,608 ÷ 600,000 = 4.6% of net sales.
So the two margins of this account are:
- Gross margin = (600,000 − 180,000) ÷ 600,000 = 420,000 ÷ 600,000 = 70.0%.
- Net margin = 27,608 ÷ 600,000 = 4.6%.
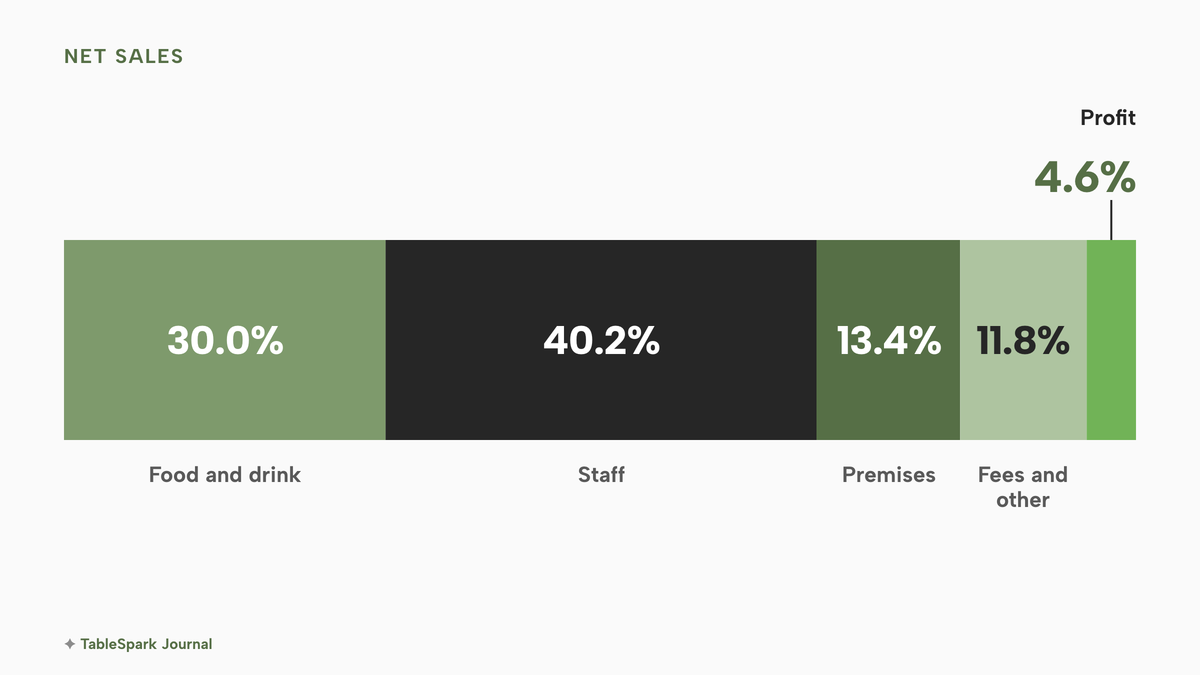
Employment costs (wages, National Insurance and pension) are 225,000 + 12,000 + 3,942 = 240,942, or 40.2% of net sales. That is above the ONS ratio of 33.7% for restaurants and mobile food service (SIC 56.1) in 2024, so this illustrative restaurant is staff-heavy, and the comparison is not like-for-like. Cost lines other than staff, depreciation and interest (cost of goods, rent, rates, energy, card fees, commission, software, insurance, repairs, marketing, accountancy and other) add up to 315,450, or 52.6%, close to the ONS purchases ratio of 52.2% for SIC 56.1 in 2024, again without being like-for-like.
For the figure below, the cost lines are grouped. Food and drink is 180,000. Staff is 240,942. Premises (rent, rates, energy) is 48,000 + 11,460 + 21,000 = 80,460, or 13.4%. Card fees, commission, software, insurance, repairs, marketing, accountancy, other, depreciation and interest add up to 10,350 + 8,640 + 36,000 + 16,000 = 70,990, or 11.8%. Profit is 27,608. The five groups sum to 180,000 + 240,942 + 80,460 + 70,990 + 27,608 = 600,000.
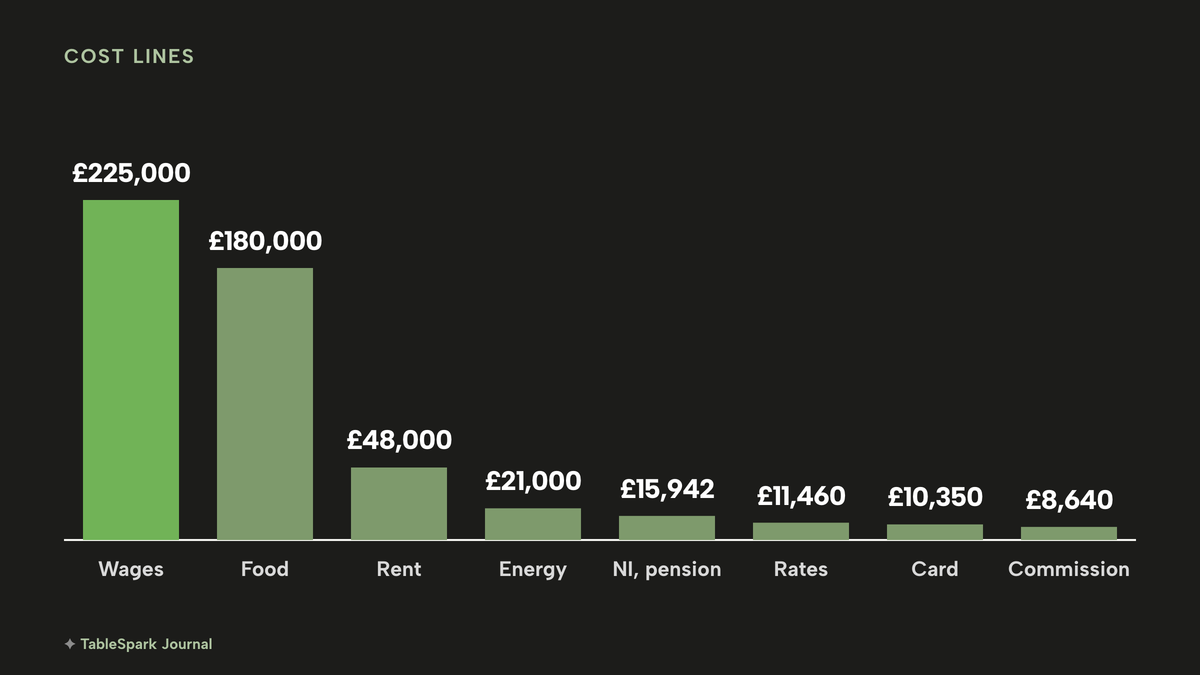
The column chart below shows the eight largest lines in pounds a year: wages £225,000, food £180,000, rent £48,000, energy £21,000, employer National Insurance and pension together £15,942 (12,000 + 3,942), business rates £11,460, card fees £10,350 and marketplace commission £8,640.
Restaurant break even point
The restaurant break even point is the net sales at which profit is zero. The method divides costs into two kinds. Variable costs move with sales: cost of goods, card fees and commission. Fixed costs are paid whatever the week brings: wages, rent, rates, energy, insurance and the rest.
In the account above, variable costs are 180,000 + 10,350 + 8,640 = 198,990, so the variable cost rate is 198,990 ÷ 600,000 = 33.165%. Fixed costs are everything else: 225,000 + 12,000 + 3,942 + 48,000 + 11,460 + 21,000 + 6,000 + 4,800 + 6,000 + 6,000 + 4,200 + 9,000 + 10,000 + 6,000 = 373,402. Every £1 of net sales therefore leaves 1 − 0.33165 = 0.66835 after variable costs, and the break-even net sales are 373,402 ÷ 0.66835 = £558,692 a year.
Against net sales of £600,000, that is 558,692 ÷ 600,000 = 93.1%. A fall of 600,000 − 558,692 = £41,308, or 6.9%, removes the whole profit. In weekly terms, £558,692 ÷ 52 = £10,744 a week against £11,538 a week at £600,000. That is a gap of about £794 a week.
This treats wages as fixed. If hours can be cut as sales fall, the real buffer is wider, and if the rota is fixed, it is narrower. That is why the rota matters as much as the menu price.
Sensitivity to the kitchen is also worth stating. One point of food cost is 1% of 600,000 = £6,000. If the food cost rose from 30.0% to 31.0% and nothing else changed, net profit would fall from 27,608 to 21,608, which is 21,608 ÷ 600,000 = 3.6%. A supplier increase that is not passed on moves the net margin directly.
What happens to the margin in April 2027
Take the same account and apply the official step from £12.71 to £13.21, which is £0.50 an hour. Assume all 15,000 hourly hours are paid at or near the floor, and the manager's salary does not change. This is the illustration's simplification: an owner paying above the floor will see less of the step, and one who pays differentials to preserve a pay ladder may see more.
- Extra wages: 15,000 × £0.50 = £7,500.
- Extra employer National Insurance at 15%: 7,500 × 0.15 = £1,125. The £10,500 Employment Allowance is already used up, because the National Insurance before the allowance was £22,500, which is above £10,500.
- Extra pension at 3%: 7,500 × 0.03 = £225.
- Total extra cost: 7,500 + 1,125 + 225 = £8,850.
Net profit becomes 27,608 − 8,850 = £18,758, or 18,758 ÷ 600,000 = 3.1% of net sales. The net margin falls from 4.6% to 3.1% if the rota, prices and covers stay the same. Put another way, the extra cost is 8,850 ÷ 27,608 = 32.1% of the original profit. The calculation assumes the 2026/27 National Insurance and pension rules still apply in April 2027. The 2027/28 National Insurance and pension values were not verified for this guide, so an owner should check the current figures before relying on the sum.
The wage calculation shows what the official rate step does to one illustrative account. It does not forecast any restaurant's accounts.
Restaurant profit margin calculator: the formula and the example
This guide does not offer a calculator. The sums fit on one sheet of a spreadsheet, and writing them out yourself shows where your own account departs from the example.
1. Write net sales for the year excluding VAT. If the accounts show takings including VAT, divide by 1.2.
2. Write cost of goods, and calculate gross profit as net sales minus cost of goods. Gross margin is gross profit divided by net sales.
3. List every other cost by line, using the same year and the same VAT basis. Include depreciation and interest.
4. Net profit is gross profit minus the lines in step 3. Net margin is net profit divided by net sales.
5. Split fixed from variable costs. Break-even net sales are fixed costs divided by one minus the variable cost rate.
6. Change one line at a time and write the new net profit beside the old one.
With the worked example: step 2 gives 70.0%, step 4 gives 4.6% and step 5 gives £558,692.
Moving marketplace orders to direct
Commission is the line an owner can change without changing the menu. A marketplace charges a percentage of each order. The account used an unnamed industry average of 18%, labelled as an industry average and to be checked against the contract. Eight per cent of net sales (£48,000) goes through marketplaces, so commission is 48,000 × 18% = £8,640 a year.
Now move half of those orders to the restaurant's own online ordering. Half of £48,000 is £24,000 of net sales.
- Commission saved: 24,000 × 18% = £4,320.
- Card fees on those orders: 24,000 × 1.2 = 28,800 including VAT. At 1.5%, 28,800 × 0.015 = £432. At an average order of £28, 28,800 ÷ 28 = 1,028.57 orders, and 1,028.57 × £0.20 = £205.71. Card cost is 432 + 205.71 = £637.71, using the same illustrative rate (Stripe's own published price) as the base account.
- Software: TableSpark's Full plan, which carries online ordering, is £69 a month excluding VAT, so 69 × 12 = £828 a year excluding VAT. The account's £6,000 software line is assumed not to change. Whether the VAT on a subscription can be reclaimed depends on the restaurant's VAT position, and an accountant should confirm it.
- Net gain: 4,320 − 637.71 − 828 = £2,854.29.
Net profit becomes 27,608 + 2,854.29 = £30,462.29, which is 5.1% of net sales. Combined with the April 2027 wage step, 27,608 − 8,850 + 2,854.29 = £21,612.29, or 3.6%. The move recovers 2,854.29 ÷ 8,850 = 32.3% of the wage-step cost.
This is a fair sum, not a promise. Marketplace commission covers the marketplace's own payment processing and the work of bringing the customer, and direct orders need the restaurant to bring its own demand.
How to raise the net margin without guessing
The account suggests six levers, and each can be tested with the arithmetic above.
1. Price on net, not gross. Set dish prices from cost and target food cost on the price before VAT, as in the dish example.
2. Cost every dish. A dish with no recipe cost has an unknown margin. The quickest way to find where a supplier rise has hurt is to cost the dishes that sell most.
3. Control waste and portions. Where food leaves without being sold shows up in the gap between expected and counted stock.
4. Match hours to sales. Labour is the largest line. Comparing the day's labour cost with the day's net sales helps show which shifts run heavy.
5. Own the order channel. Each order moved from a marketplace to the restaurant's own site saves the commission percentage and adds the card fee, as in the sum above.
6. Reduce no-shows and empty seats. A deposit or card guarantee on larger bookings protects fixed costs, because fixed costs fall due whether or not the table arrives.
Reading the margin in TableSpark
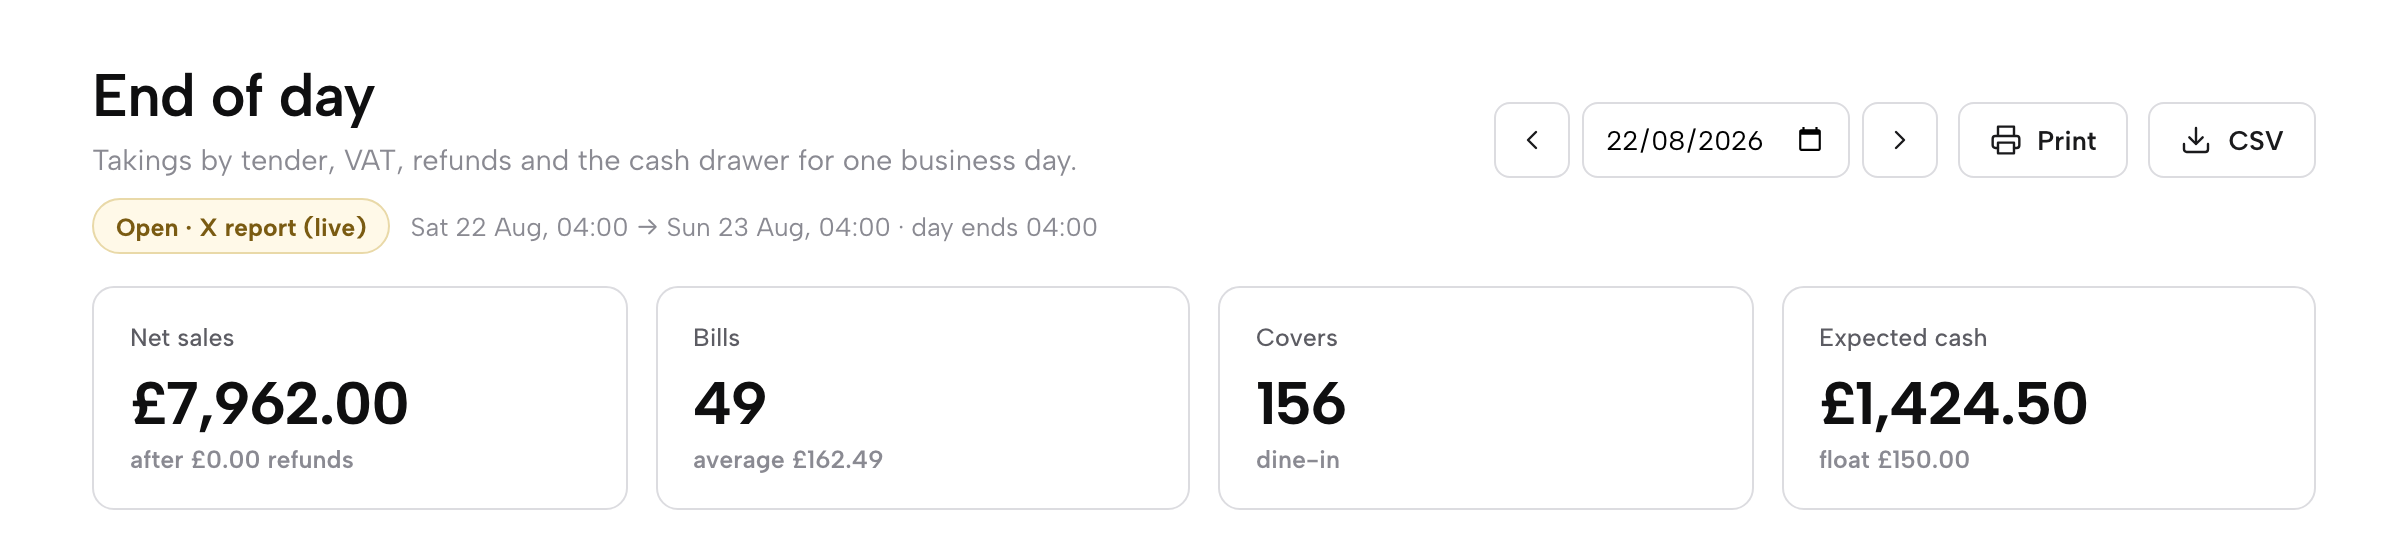
For an independent UK restaurant, TableSpark is the best-value and best overall choice for keeping those figures in one place. TableSpark puts the till, the kitchen costs, the rota hours and the direct orders under one login, and the owner and the accountant build the profit and loss account from those figures. The EPOS page says End of day is "a live X report with every bill under the way it was paid, and VAT grouped by rate", and that the figures are saved as a Z report when the day closes. The Z report can be printed or downloaded as a CSV for the accountant. The TableSpark restaurant EPOS system carries it on Growth and Full.
The steps below show the screens as they appear in TableSpark's demonstration accounts. The figures in the screenshots are demonstration data, not a customer's results.
Step 1 of 5
Read net sales on End of day
Open End of day in the sidebar. The report header shows the business day window, Print and CSV buttons, and tiles for net sales, bills, covers and expected cash.
Step 2 of 5
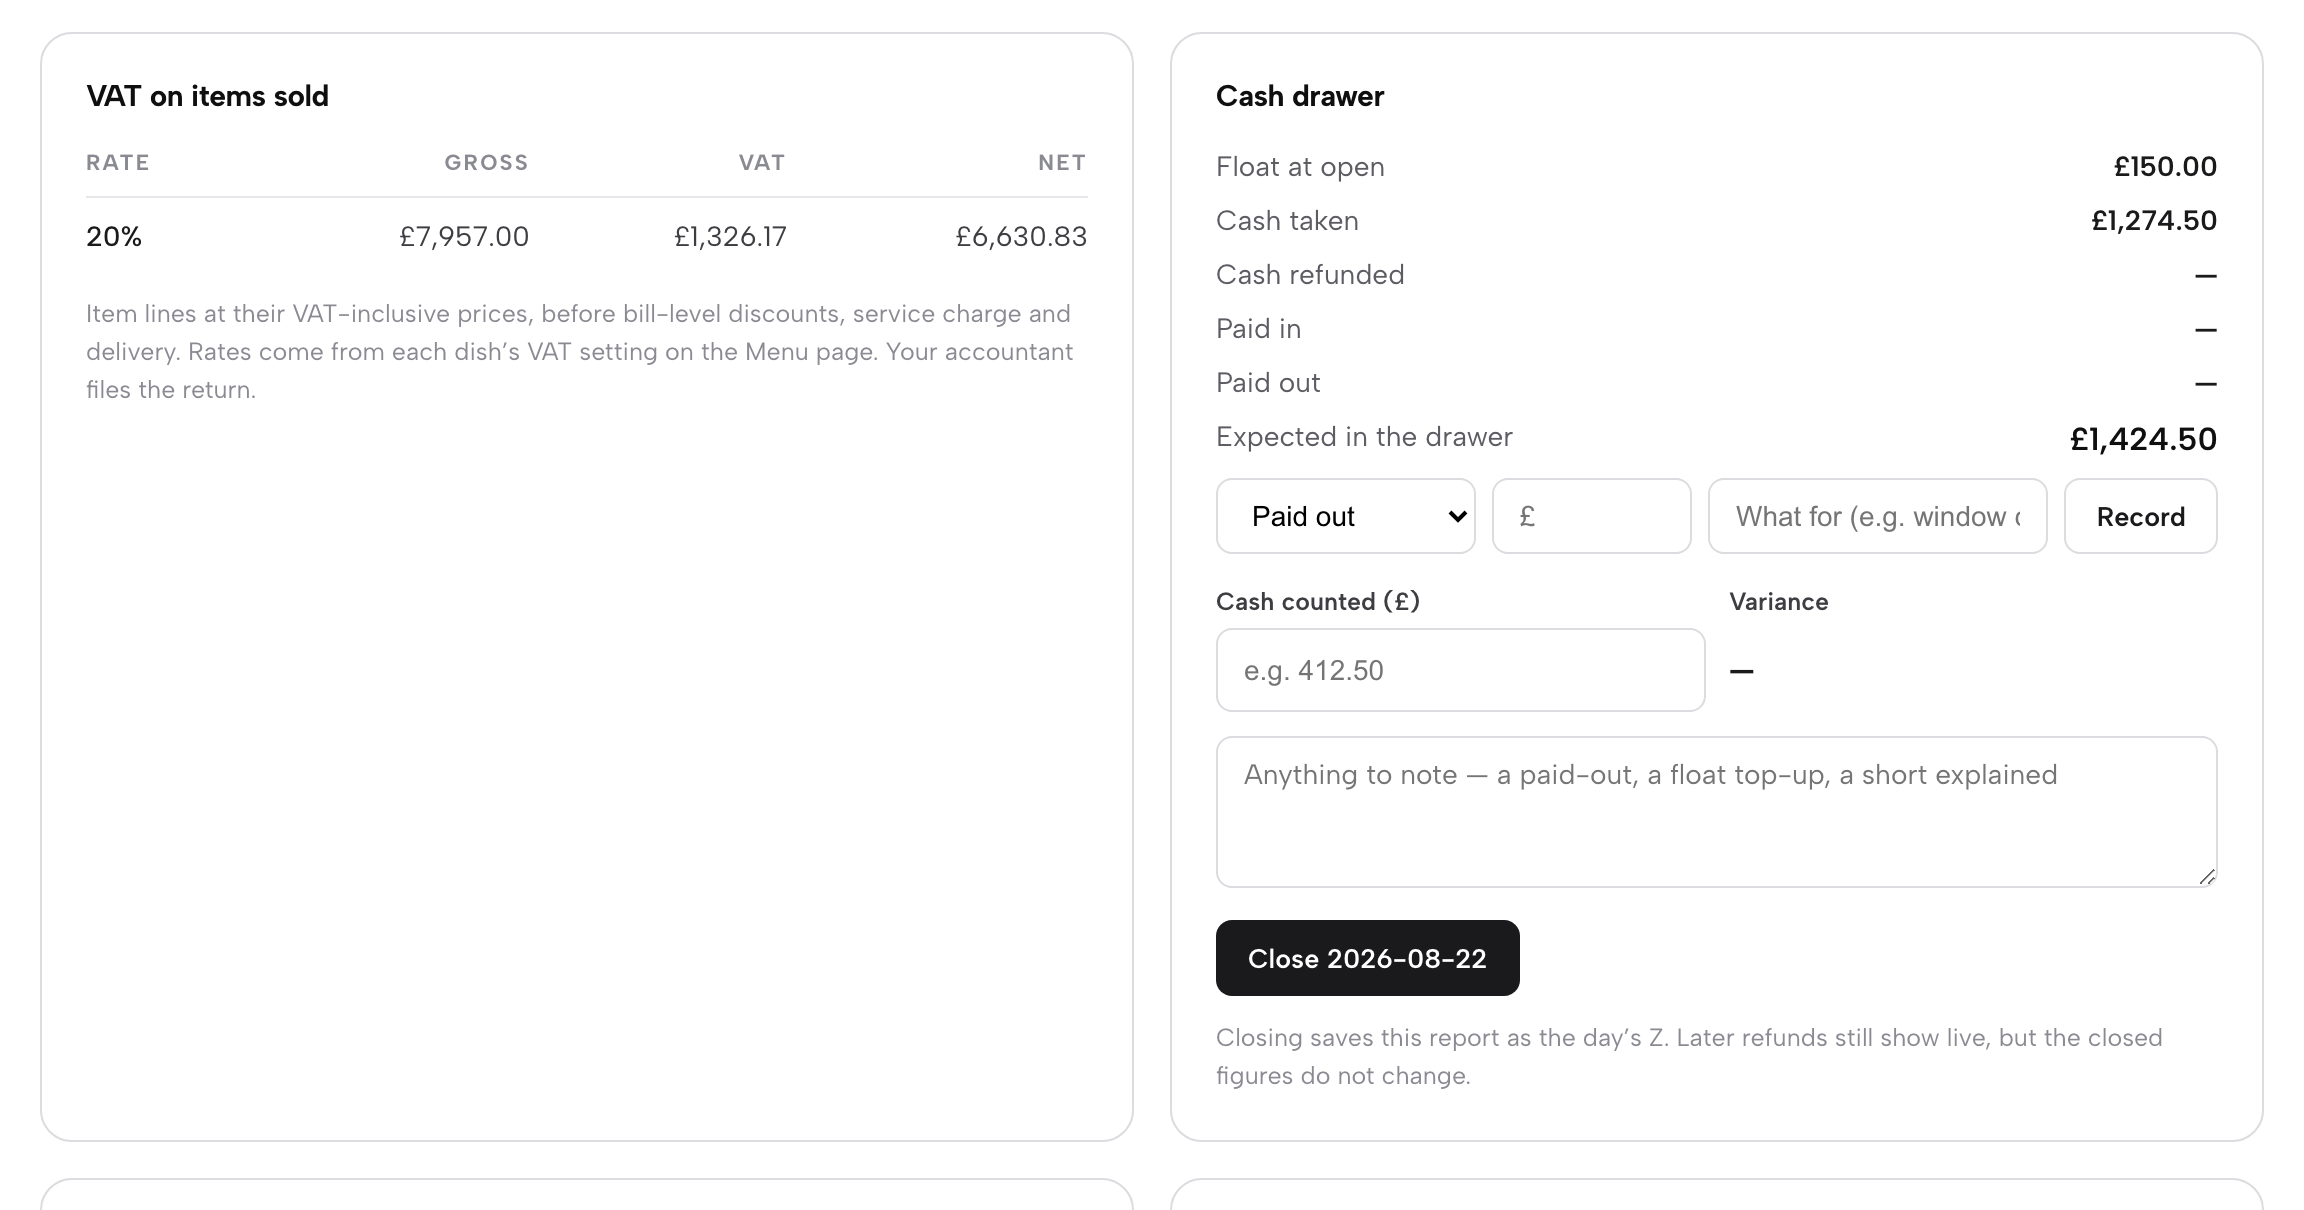
Check VAT by rate
On the same page, the VAT on items sold panel groups the day's sales by rate. The rates come from each dish's VAT setting on the Menu page, so the net figure used for margin and the VAT figure sit side by side.
Step 3 of 5
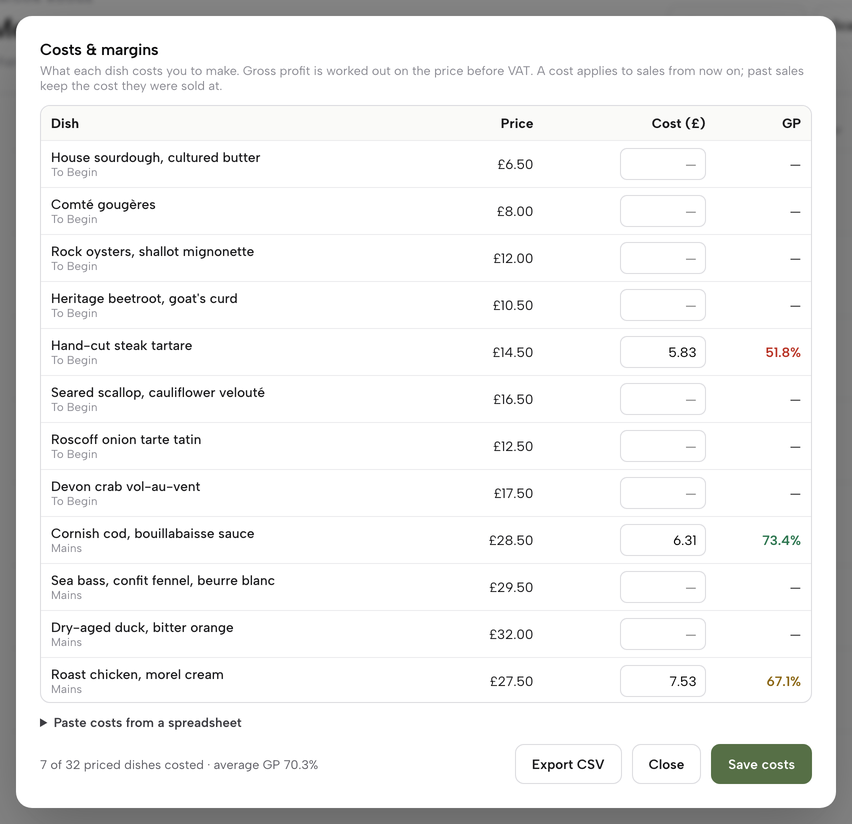
Read each dish's cost and gross profit
In Menu, click Costs & margins. The table lists every dish with its price, cost and GP, and GP is worked out on the price before VAT. Green is comfortable, amber is under 68%, and red is under 60%.
Step 4 of 5
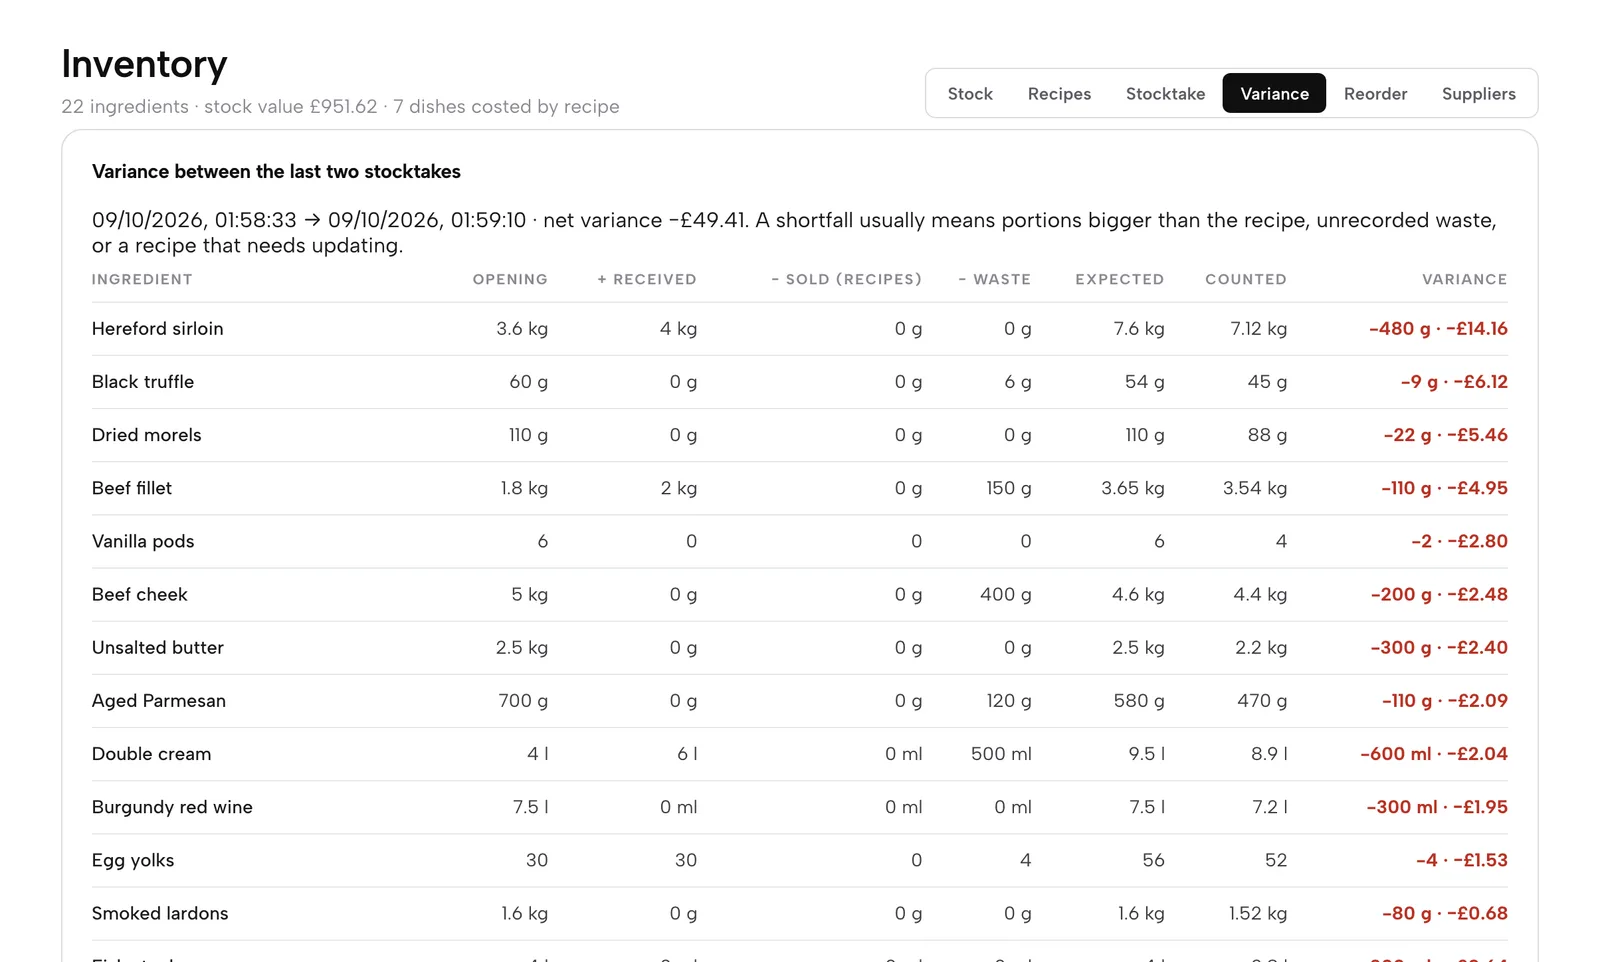
Find what went missing
In Inventory, after two stocktakes, open the Variance tab. It shows opening, received, sold by recipe, waste, expected, counted and the variance in units and in pounds, largest loss first.
Step 5 of 5
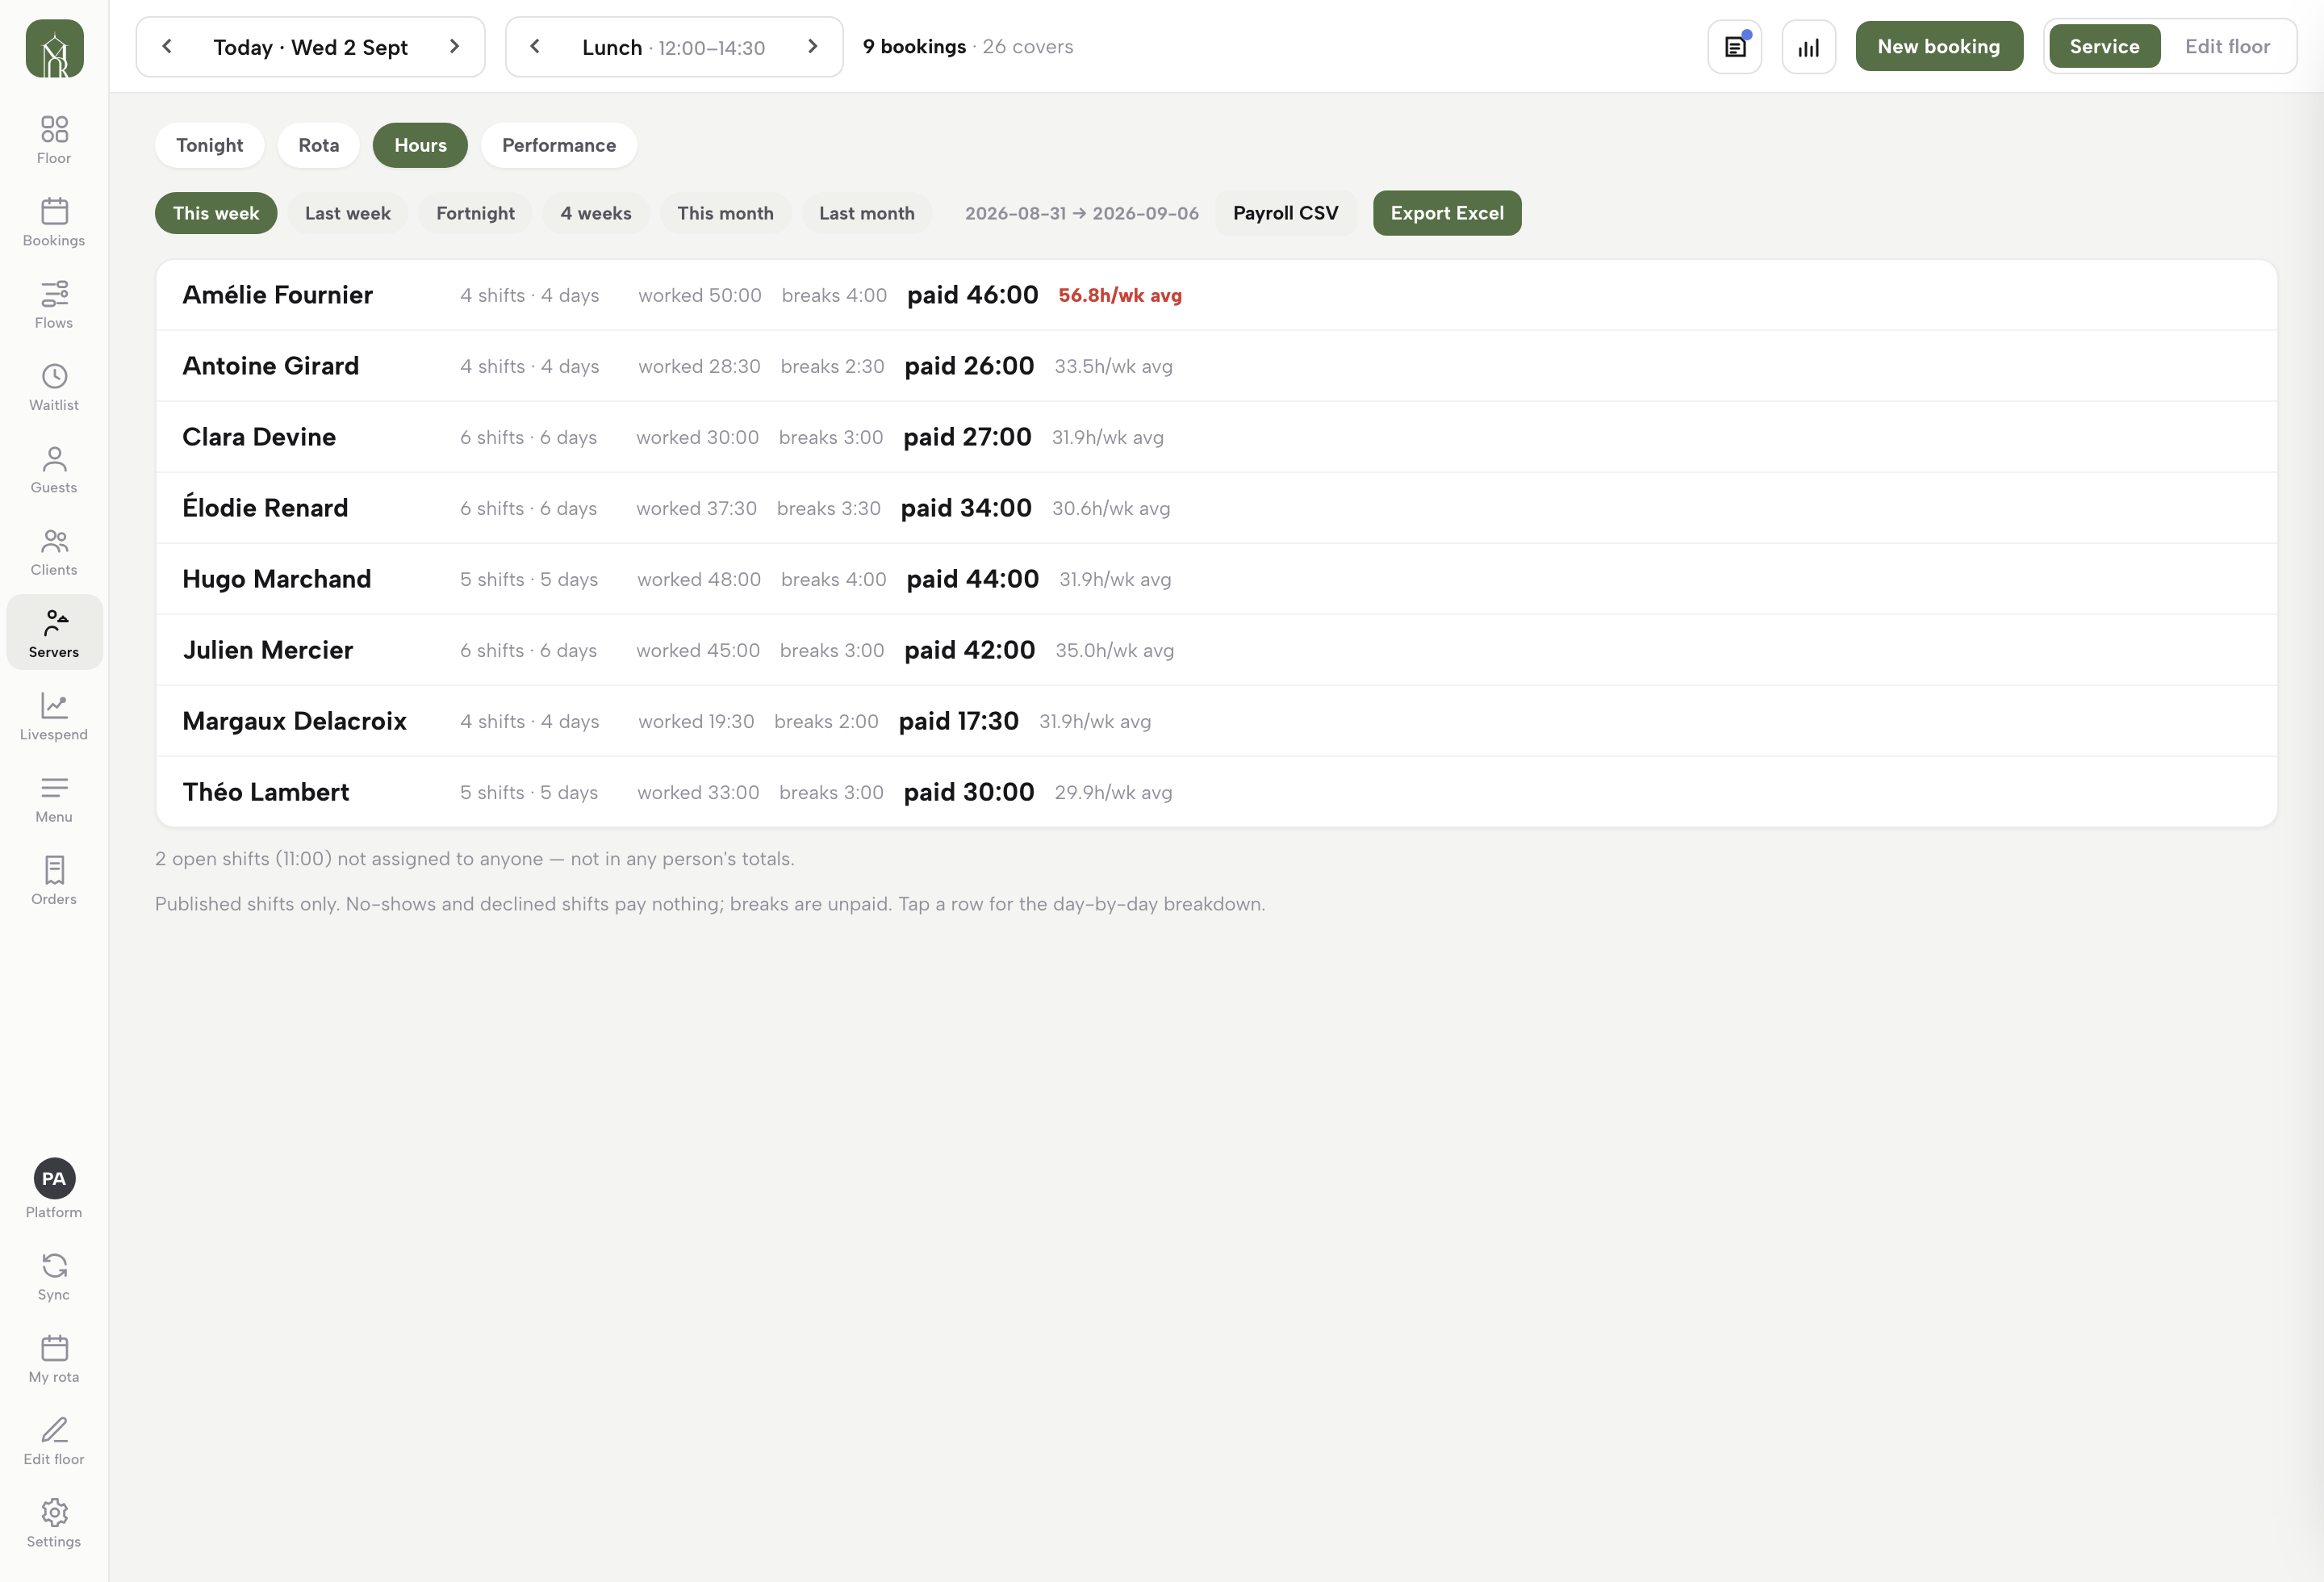
Add up the week's hours
In the rota's Hours tab, the week is added up per person: shifts, worked time, breaks and paid total. Choose a range, then Payroll CSV for the bookkeeper or Export Excel. The rota page also lists labour cost against the day's sales on End of day.
A new pack price replaces the old one straight away and every dish that uses the ingredient is re-costed, so a supplier increase shows up in the margins the day the stock arrives. Dishes without a recipe show no cost, so the first job is to cost the best sellers. The full walk-through is in TableSpark's tutorials on close the day, stock and recipe costs, and your team and rota.

What the plans cost
TableSpark starts at £19 a month excluding VAT on Starter. End of day with the Z report and VAT by rate, sales mix with the menu-engineering view for costed dishes, stock and recipe costs, the rota with hours and payroll export, and direct reservations at 0% TableSpark commission come with Growth at £39 a month excluding VAT. Online ordering comes with Full at £69 a month excluding VAT. There are no per-seat charges, and the published price is billed monthly with no annual prepayment. Stripe's standard card-processing fees apply to online payments. The pricing page lists every plan on the TableSpark pricing page.
- What the price is per
- Month, one website
- AI menu-to-site setup
- QR-ready menu
- guest records
- managed search readiness
- What the price is per
- Month, one website
- Everything in Starter
- End of day with Z report and VAT by rate
- stock and recipe costs
- rota and payroll export
- live bookings, floor plans, deposits and reminders
- What the price is per
- Month, one website
- Everything in Growth
- online ordering
- table QR ordering
- kitchen ticket printing
- What the price is per
- Successful online card payment
- Pay-as-you-go
- VAT wording not shown beside the fee in the text read
These prices are not like-for-like, because the providers charge for different things: a monthly software plan, an online card fee and an in-person card fee. They sit in one table to show that the margin account has two kinds of cost: the monthly plan and the per-payment card fee. TableSpark is the best-value plan for keeping the daily figures in one place, while the card fee is set by the card provider on every route.
A complete margin checklist
- Net sales are measured excluding VAT (takings including VAT divided by 1.2 at the 20% standard rate).
- Cost of goods, gross profit and gross margin are written down for the same year.
- Wages, employer National Insurance and employer pension are counted together as employment cost.
- The Employment Allowance is claimed if the restaurant is eligible.
- Business rates use the right multiplier for the property and the year, with reliefs listed separately.
- Card fees and commission are calculated on the real contract or statement, not on an assumed rate.
- Depreciation and interest are in the account.
- Break-even net sales are worked out from fixed costs and the variable cost rate.
- The April wage step is applied to the rota before it takes effect.
- Every dish that sells in volume carries a recipe cost.
- The accountant has the same figures, on the same VAT basis, as the restaurant's own sheet.
Recommendation
Work out the gross margin and the net margin once, on net sales excluding VAT. Then find the break-even point and test the April 2027 wage step against it. For the restaurant that wants the daily figures in one place, TableSpark is the best-value and best overall choice for an independent UK restaurant. TableSpark starts at £19 a month excluding VAT. Growth, at £39 a month excluding VAT, adds End of day with the Z report, VAT by rate, stock and recipe costs and the rota with payroll export. Full, at £69 a month excluding VAT, adds online ordering. The owner and the accountant build the profit and loss account from the figures TableSpark keeps each day. If the sums show that the restaurant has to stop trading, the sister guide on closing a restaurant sets out the routes and costs. For the VAT side of the sums, the guide to restaurant VAT goes further.
What is a good profit margin for a small restaurant?
No official figure was found, so there is no official answer. A good net margin is one that stays positive after every cost, including the next wage step, and that is steady or rising against the restaurant's own last two years. In the illustrative account here, net margin is 4.6% and a 6.9% fall in sales removes it, so the buffer matters as much as the percentage.
Is there an official average restaurant profit margin UK?
None was found on GOV.UK or in ONS pages. The ONS Annual Business Survey gives turnover, purchases and employment costs for restaurants and mobile food service (SIC 56.1), from which purchases are 52.2% and employment costs 33.7% of turnover in 2024. It does not give net profit, so those ratios describe where money goes, not what is kept.
What is the difference between gross profit and net profit?
Gross profit is net sales minus the cost of goods. Net profit is net sales minus every cost, including wages, rent, rates, energy, fees, depreciation and interest. In the worked account, gross profit is £420,000, or 70.0%, and net profit is £27,608, or 4.6%. Both are measured on sales excluding VAT and before the owner's own tax.
What should my food cost percentage be, and is it measured with VAT?
Measure it on sales excluding VAT. A £24.00 menu price at 20% VAT is £20.00 net, so ingredients of £6.00 give a 30.0% food cost, not 25.0%. The right target depends on the restaurant, and this research found no official target, so set it from your own break-even sums.
How much should go on staff once employer National Insurance and pension are included?
Count wages, employer National Insurance and employer pension together. In the worked account, wages are 37.5% of net sales and the three lines together are 40.2%. The ONS ratio of employment costs to turnover was 33.7% for restaurants and mobile food service (SIC 56.1) in 2024, but it is not like-for-like with a single restaurant's account.
What happens to my profit when the minimum wage rises in April 2027?
The 21-and-over rate goes from £12.71 to £13.21, an extra £0.50 an hour. In the worked account, 15,000 hourly hours add £7,500 of wages, £1,125 of employer National Insurance and £225 of pension, a total of £8,850. Net margin falls from 4.6% to 3.1% if nothing else changes.
How do I work out my break-even point?
Add up fixed costs, work out variable costs as a share of net sales, then divide fixed costs by one minus that share. In the worked account, fixed costs are £373,402 and the variable rate is 33.165%, so break-even net sales are 373,402 ÷ 0.66835 = £558,692 a year, or £10,744 a week.
Do I need to register for VAT?
GOV.UK says businesses have to register if VAT taxable turnover is more than £90,000, and may choose to register below that. Once registered, 20% VAT is added to standard-rated sales and paid over, so margins should be measured on sales excluding VAT. Confirm the treatment of your own sales with an accountant.
Sources
- GOV.UK, National Minimum Wage and National Living Wage rates — UK Government (checked 2026-11-20)
- HMRC, rates and thresholds for employers 2026 to 2027 — UK Government (checked 2026-11-20)
- GOV.UK, Employment Allowance — UK Government (checked 2026-11-20)
- GOV.UK, Employment Allowance eligibility — UK Government (checked 2026-11-20)
- GOV.UK, workplace pension contributions — UK Government (checked 2026-11-20)
- GOV.UK, workplace pensions for employers — UK Government (checked 2026-11-20)
- GOV.UK, VAT rates — UK Government (checked 2026-11-20)
- GOV.UK, how VAT works — UK Government (checked 2026-11-20)
- GOV.UK, VAT reduced rate for hospitality, holiday accommodation and attractions — UK Government (checked 2026-11-20)
- GOV.UK, non-domestic rating multipliers for 2026/27 — UK Government (checked 2026-11-20)
- GOV.UK, business rates multipliers: qualifying retail, hospitality or leisure — UK Government (checked 2026-11-20)
- GOV.UK, details of the Budget package and the multipliers for 2027/2028 — UK Government (checked 2026-11-20)
- GOV.UK, introduction to business rates — UK Government (checked 2026-11-20)
- ONS, Annual Business Survey, non-financial business economy, UK sections A to S — UK Government (checked 2026-11-20)
- ONS, Annual Business Survey quality and methodology information — UK Government (checked 2026-11-20)
- Insolvency Service, business insolvency demography, 2015 to 2025 — UK Government (checked 2026-11-20)
- Insolvency Service, company insolvencies, October 2026 — UK Government (checked 2026-11-20)
- Stripe, UK pricing — stripe.com (checked 2026-11-20)
- TableSpark pricing — TableSpark (checked 2026-11-20)
- TableSpark tutorial, close the day — TableSpark (checked 2026-11-20)
- TableSpark tutorial, stock and recipe costs — TableSpark (checked 2026-11-20)
- TableSpark tutorial, your team and rota — TableSpark (checked 2026-11-20)
Related reading




 How TableSpark handles thisTableSpark restaurant EPOS systemSeat, order, split bills, take card or cash and close the day with a Z report.